No, Google Scholar Shouldn’t be Used Alone for Systematic Review Searching

9 07 2013

Several papers have addressed the usefulness of Google Scholar as a source for systematic review searching. Unfortunately the quality of those papers is often well below the mark.

In 2010 I already [1]  (in the words of Isla Kuhn [2]) “robustly rebutted” the Anders’ paper PubMed versus Google Scholar for Retrieving Evidence” [3] at this blog.

But earlier this year another controversial paper was published [4]:

“Is the coverage of google scholar enough to be used alone for systematic reviews?

It is one of the highly accessed papers of BMC Medical Informatics and Decision Making and has been welcomed in (for instance) the Twittosphere.

Researchers seem  to blindly accept the conclusions of the paper:

https://twitter.com/jeffvallance/status/340562086524510208

But don’t rush  and assume you can now forget about PubMed, MEDLINE, Cochrane and EMBASE for your systematic review search and just do a simple Google Scholar (GS) search instead.

You might  throw the baby out with the bath water….

… As has been immediately recognized by many librarians, either at their blogs (see blogs of Dean Giustini [5], Patricia Anderson [6] and Isla Kuhn [1]) or as direct comments to the paper (by Tuulevi OvaskaMichelle Fiander and Alison Weightman [7].

In their paper, Jean-François Gehanno et al examined whether GS was able to retrieve all the 738 original studies included in 29 Cochrane and JAMA systematic reviews.

And YES! GS had a coverage of 100%!

WOW!

All those fools at the Cochrane who do exhaustive searches in multiple databases using controlled vocabulary and a lot of synonyms when a simple search in GS could have sufficed…

But it is a logical fallacy to conclude from their findings that GS alone will suffice for SR-searching.

Firstly, as Tuulevi [7] rightly points out :

“Of course GS will find what you already know exists”

Or in the words of one of the official reviewers [8]:

What the authors show is only that if one knows what studies should be identified, then one can go to GS, search for them one by one, and find out that they are indexed. But, if a researcher already knows the studies that should be included in a systematic review, why bother to also check whether those studies are indexed in GS?

Right!

Secondly, it is also the precision that counts.

As Dean explains at his blog a 100% recall with a precision of 0,1% (and it can be worse!) means that in order to find 36 relevant papers you have to go through  ~36,700 items.

Dean:

Are the authors suggesting that researchers consider a precision level of 0.1% acceptable for the SR? Who has time to sift through that amount of information?

It is like searching for needles in a haystack.  Correction: It is like searching for particular hay stalks in a hay stack. It is very difficult to find them if they are hidden among other hay stalks. Suppose the hay stalks were all labeled (title), and I would have a powerful haystalk magnet (“title search”)  it would be a piece of cake to retrieve them. This is what we call “known item search”. But would you even consider going through the haystack and check the stalks one by one? Because that is what we have to do if we use Google Scholar as a one stop search tool for systematic reviews.

Another main point of criticism is that the authors have a grave and worrisome lack of understanding of the systematic review methodology [6] and don’t grasp the importance of the search interface and knowledge of indexing which are both integral to searching for systematic reviews.[7]

One wonders why the paper even passed the peer review, as one of the two reviewers (Miguel Garcia-Perez [8]) already smashed the paper to pieces.

The authors’ method is inadequate and their conclusion is not logically connected to their results. No revision (major, minor, or discretionary) will save this work. (…)

Miguel’s well funded criticism was not well addressed by the authors [9]. Apparently the editors didn’t see through and relied on the second peer reviewer [10], who merely said it was a “great job” etcetera, but that recall should not be written with a capital R.
(and that was about the only revision the authors made)

Perhaps it needs another paper to convince Gehanno et al and the uncritical readers of their manuscript.

Such a paper might just have been published [11]. It is written by Dean Giustini and Maged Kamel Boulos and is entitled:

Google Scholar is not enough to be used alone for systematic reviews

It is a simple and straightforward paper, but it makes its points clearly.

Giustini and Kamel Boulos looked for a recent SR in their own area of expertise (Chou et al [12]), that included a comparable number of references as that of Gehanno et al. Next they test GS’ ability to locate these references.

Although most papers cited by Chou et al. (n=476/506;  ~95%) were ultimately found in GS, numerous iterative searches were required to find the references and each citation had to be managed once at a time. Thus GS was not able to locate all references found by Chou et al. and the whole exercise was rather cumbersome.

As expected, trying to find the papers by a “real-life” GS search was almost impossible. Because due to its rudimentary structure, GS did not understand the expert search strings and was unable to translate them. Thus using Chou et al.’s original search strategy and keywords yielded unmanageable results of approximately >750,000 items.

Giustini and Kamel Boulos note that GS’ ability to search into the full-text of papers combined with its PageRank’s algorithm can be useful.

On the other hand GS’ changing content, unknown updating practices and poor reliability make it an inappropriate sole choice for systematic reviewers:

As searchers, we were often uncertain that results found one day in GS had not changed a day later and trying to replicate searches with date delimiters in GS did not help. Papers found today in GS did not mean they would be there tomorrow.

But most importantly, not all known items could be found and the search process and selection are too cumbersome.

Thus shall we now for once and for all conclude that GS is NOT sufficient to be used alone for SR searching?

We don’t need another bad paper addressing this.

But I would really welcome a well performed paper looking at the additional value of a GS in SR-searching. For I am sure that GS may be valuable for some questions and some topics in some respects. We have to find out which.

References

  1. PubMed versus Google Scholar for Retrieving Evidence 2010/06 (laikaspoetnik.wordpress.com)
  2. Google scholar for systematic reviews…. hmmmm  2013/01 (ilk21.wordpress.com)
  3. Anders M.E. & Evans D.P. (2010) Comparison of PubMed and Google Scholar literature searches, Respiratory care, May;55(5):578-83  PMID:
  4. Gehanno J.F., Rollin L. & Darmoni S. (2013). Is the coverage of Google Scholar enough to be used alone for systematic reviews., BMC medical informatics and decision making, 13:7  PMID:  (open access)
  5. Is Google scholar enough for SR searching? No. 2013/01 (blogs.ubc.ca/dean)
  6. What’s Wrong With Google Scholar for “Systematic” Review 2013/01 (etechlib.wordpress.com)
  7. Comments at Gehanno’s paper (www.biomedcentral.com)
  8. Official Reviewer’s report of Gehanno’s paper [1]: Miguel Garcia-Perez, 2012/09
  9. Authors response to comments  (www.biomedcentral.com)
  10. Official Reviewer’s report of Gehanno’s paper [2]: Henrik von Wehrden, 2012/10
  11. Giustini D. & Kamel Boulos M.N. (2013). Google Scholar is not enough to be used alone for systematic reviews, Online Journal of Public Health Informatics, 5 (2) DOI:
  12. Chou W.Y.S., Prestin A., Lyons C. & Wen K.Y. (2013). Web 2.0 for Health Promotion: Reviewing the Current Evidence, American Journal of Public Health, 103 (1) e9-e18. DOI:


Diane-35: Geen Reden tot Paniek!

12 03 2013

Dear english-speaking readers of this blog.

This post is about the anti-acne drug Diane-35 that (with other 3rd and 4th generation combined oral contraceptives (COCs)) has been linked to the deaths of several women in Canada, France and the Netherlands. Since there is a lot of media attention (and panic) in the Netherlands, the remainder of this post is in Dutch. Please write in the comments (or tweet) if you would like me to summarize the health concerns of these COCs in a separate English post.

————————-

Mediaophef 

Er is de laatste tijd nogal veel media-aandacht voor Diane-35. Het begon allemaal in Frankrijk, waar de Franse toezichthouder op geneesmiddelen ANSM Diane-35* eind januari van de markt wilde halen omdat in de afgelopen 25 jaar 4 vrouwen na het gebruik ervan waren overleden. In beroep werd dit afgewezen, waarna de ANSM de EMA (European Medicines Agency) verzocht om de veiligheid van Diane en 3e/4e generatie orale combinatie anticonceptiepillen (OAC) nog eens te onderzoeken.

In januari overleed ook een 21-jarige gebruikster van Diane-35 in Nederland. Met terugwerkende kracht ontving het Nederlandse Bijwerkingscentrum Lareb 97 meldingen van bijwerkingen van Diane-35. Hieronder waren 9 sterfgevallen uit 2011 en eerder.** Overigens werden ook sterfgevallen gemeld van vrouwen die vergelijkbare (3e en 4e generatie) orale anticonceptiemiddelen hadden gebruikt, zoals Yasmin.

Alle vrouwen zijn overleden aan bloedproppen in bloedvaten (trombose dan wel longembolie).  Totaal waren er  89 meldingen van bloedstolsels, wat altijd (ook zonder dodelijke afloop) een ernstige bijwerking is.

Aanleiding voor Canada en België, om ook in de statistieken te duiken. In Canada bleken sinds 2000 11 vrouwen die Diane-35 slikten te zijn overleden en in België zijn er sinds 2008 29 meldingen van trombose door het gebruik van de 3e/4e generatiepil (5 door Diane-35, geen doden)

Dit nieuws sloeg in als een bom. Veel mensen raakten in paniek. Of zijn boos op Bayer*, het CBG (College ter Beoordeling van Geneesmiddelen) en/of minister Schippers die het naar hun idee laten afweten. Op Twitter zie ik aan de lopende band tweets voorbijkomen als:

Diane-35 pil: heet deze zo omdat je er niet altijd de 35 jaar mee haalt?“.

Tonnen #rundvlees halen we uit de handel om wat #paardenvlees. Maar doden door de Diane 35 #pil doet de regering niks mee.

Oud Nieuws

Dergelijke reacties zijn sterk overdreven. Er is absoluut geen reden tot paniek.

Echter waar rook is, is vuur. Ook al gaat het hier om een klein brandje.

Maar wat betreft Diane-35 is die rook er al jaren…. Waarom roept men nu ineens: “Brand!”?

De meeste sterfgevallen zijn van vòòr dit jaar. Dat de Fransen authoriteiten nu zoveel daadkracht tonen komt waarschijnlijk omdat hen laksheid verweten werd bij recente schandalen met PIP-borstimplantaten en Mediator, dat meer dan 500 sterfgevallen veroorzaakt heeft. [Reuterszie ook het blog van Henk Jan Out]

Verder was allang bekend dat Diane-35 de kans op bloedstolsels verhoogde.

Niet alleen Diane-35

Men kan de risico’s van Diane-35 niet los zien van de risico’s van orale anticonceptiemiddelen (OAC’s) in het algemeen.

Diane-35 lijkt qua samenstelling erg op de 3e generatie OAC.  Het is echter uniek omdat het in plaats van een 3e generatie progestogeen cyproteronacetaat bevat. ‘De pil’ bevat levonorgestrel, dit is een 2e generatie progestogeen. Al de OAC combinatiepillen bevatten daarnaast (tegenwoordig) een lage dosering ethinylestradiol.

Zoals gezegd, is al jaren bekend dat alle OAC’s, dus ook ‘de pil’, de kans op bloedstolsels in bloedvaten licht verhogen[1,2,3]. Op zijn hoogst verhogen 2e generatie OAC’s (met levonorgestrel) die kans met een factor 4. Derde generatie pillen lijken die kans verder te verhogen. Met hoeveel precies, daarover verschillen de meningen. Voor wat beteft Diane-35, ziet de een géén tot nauwelijks effect [4], de ander een 1,5 [5]  tot 2 x [3] sterker effect.  Het totaalplaatje ziet er ongeveer als volgt uit:

7-3-2013 15-48-49 risico's pil

Absolute en relatieve kans op VTE (Veneuze trombo-embolie).
Uit: http://www.anticonceptie-online.nl/pil.htm

Risico’s in Perspectief

Een 1,5-2 x groter risico vergeleken met de “gewone pil”, lijkt een enorm groot risico. Dit zou ook een groot effect zijn als trombo-embolie vaak voorkwam. Stel dat 1 op de 100 mensen trombose krijgt per jaar, dan zouden op jaarbasis 2-4 op de 100 mensen trombose krijgen na de ‘pil’ en 3-8 mensen na Diane-35 of een 3e of 4e generatiepil. Dit is een groot absoluut risico. Dat risico zou je normaal niet nemen.

Maar trombo-embolie is zeldzaam. Het komt voor bij 5-10 op de 100.000 vrouwen per jaar. En totaal zal 1 op miljoen vrouwen daaraan overlijden. Dat is een heel minieme kans.Vier tot zes keer een kans van iets meer dan 0 blijft een kans van bijna 0. Dus in absolute zin, brengen Diane-35 en OAC’s weinig risico met zich mee.

Daarbij komt dat trombose niet direct door de pil veroorzaakt hoeft te zijn. Roken, leeftijd, (over)gewicht, erfelijke aanleg voor stollingsproblemen kunnen ook een (grote) rol spelen. Verder kunnen deze factoren samenspelen. Om deze reden worden OAC’s (ook de pil) afgeraden aan risicogroepen (oudere vrouwen die veel roken, aanleg voor trombose e.d.)

Het aantal bijwerkingendat mogelijk samenhangt met het gebruik van Diane-35, geeft eigenlijk aan dat dit een relatief veilig middel is.

Aanvaardbaar risico?

Om het nog meer in perspectief te plaatsen: zwangerschap geeft een 2x hoger risico op trombose dan Diane-35, en in de 12 weken na de bevalling is de kans nog weer 4-8 keer hoger dan in de zwangerschap (FDA). Toch zullen vrouwen het daarvoor niet laten om zwanger te worden. Het krijgen van een kind weegt meestal (impliciet) op tegen(kleine) risico’s (waarvan trombose er één is).

Men kan de (kans op) risico’s dus niet los zien van de voordelen. Als het voordeel hoog is zal men zelfs een zeker risico op de koop toe willen nemen (afhankelijk van de ernst van de aandoening en eht nut). Aan de andere kant wil je zelfs een heel klein risico niet lopen, als je geen baat hebt bij een middel of als er even goede, maar veiliger middelen zijn.

Maar mag de patiënte die overweging niet zelf met haar arts maken?

Geen plaats voor Diane-35  als anticonceptiemiddel

Diane-35 heeft een anticonceptiewerking, maar het is hiervoor niet (langer) geregistreerd. De laatste anticonceptie-richtlijn van de nederlandse huisartsen (NHG) uit 2010 [6] zegt expliciet dat er geen plaats meer is voor de pil met cyproteronacetaat. Dit omdat de gewone ‘pil’ even goed zwangerschap voorkomt én (iets) minder kans geeft op trombose als bijwerking. Dus waarom zou je een een potentieel hoger risico lopen, als dat niet nodig is? Helaas is de NHG-standaard minder expliciet over 2e en 3e generatie OAC’s.

In andere landen denkt men vaak net zo (In de VS is Diane-35 echter niet geregistreerd).

Dit zegt bijv de RCOG (Royal College of Obstetricians and Gynaecologist, UK) in hun evidence-based richtlijn die specifiek gaat over OAC’s en kans op trombose [1]

10-3-2013 17-27-40 RCOG CPA

Diane-35 als middel tegen ernstige acne en overbeharing.

Omdat het cyproteron acetaat in Diane-35 een sterk anti-androgene werking heeft kan het worden ingezet  bij ernstige acné en overbeharing (dat laatste met name bij vrouwen met PCOS, een gynecologische aandoening). Desgewenst kan het dan tevens dienst doen als anticonceptiemiddel: 2 vliegen in één klap.

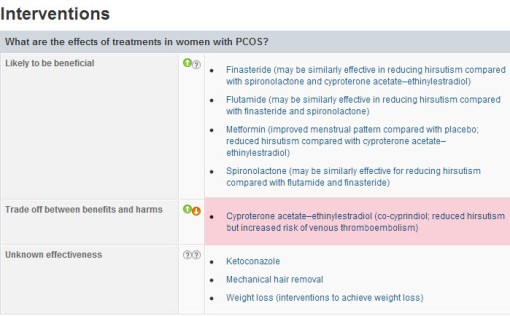
Clinical Evidence, dat een heel mooie evidence based bron is die voor-en nadelen van behandelingen tegen elkaar afzet, concludeert dat middelen met cyproteron acetaat ondanks hun prima werking, bij ernstige overbeharing (bij PCOS) niet de voorkeur verdienen boven middelen als metformine. Het risico op trombose is in deze overweging meegenomen.[7]

3-3-2013 14-54-14 CLINical Evidence PCOS cyproterone acetate

Volgens een Cochrane Systematisch Review hielpen alle OAC’s wel bij acné, maar OAC’s met cyproteron leken wat effectiever dan pillen met 2e of 3e generatie progestogeen. De resultaten waren echter tegenstrijdig en de studies niet zo erg sterk.[8]

Sommigen concluderen op basis van dit Cochrane Review dat alle OAC’s even goed helpen en dat de gewone pil dus voorkeur verdient (zie bijv. dit recente artikel van Helmerhorst in de BMJ [2], en de NHG standaard acne [9]

Maar in de meest recente Richtlijn Acneïforme Dermatosen [10] van de Nederlandse Vereniging voor Dermatologie en Venereologie (NVDV) wordt er op basis van dezelfde evidence iets anders geconcludeerd: 10-3-2013 22-43-02 ned vereniging voor dermatologie

De Nederlandse dermatologen komen dus met een positieve aanbeveling van Diane-35 ten opzichte van andere anticonceptiemiddelen bij vrouwen die ook anticonceptie wensen. Nergens in deze richtlijn wordt expliciet gerefereerd aan trombose als mogelijke bijwerking.

Het voorschrijfbeleid in de praktijk.

Als Diane-35 niet als anticonceptiemiddel voorgeschreven wordt, en het wordt slechts bij ernstige vormen van acne of overbeharing gebruikt, hoe kan dit middel met een zo’n laag risico dan zo’n omvangrijk probleem worden? De doelgroep èn de kans op bijwerkingen is immers heel klein. En hoe zit het met 3e en 4e generatie OAC’s die niet eens bij acné voorgeschreven zullen worden? Daar zou de doelgroep nog kleiner moeten zijn.

De realiteit is dat de omvang van het probleem niet zozeer door het on-label gebruik komt maar, zoals Janine Budding al aangaf op haar blog Medical Facts door off-label voorschrijfgedrag, dus voor een  andere indicatie dan waarvoor het geneesmiddel is geregistreerd. In Frankrijk gebruikt de helft van de vrouwen die OAC’s gebruiken, de 3e en 4e generatie OAC: dat is ronduit buitensporig, en niet volgens de richtlijnen.

In Nederland slikkten ruim 161.000 vrouwen Diane-35 of een generieke variant met exact dezelfde werking. Ook veel Nederlandse en Canadese gebruiken Diane-35 en andere 3e en 4e generatie OAC’s puur anticonceptiemiddel. Voor een deel, omdat sommige huisartsen het ‘in de pen’ hebben of denken dat een meisje dan gelijk van haar puistjes afgeholpen is. Voor een deel omdat, in  Nederland en  Frankrijk, Diane-35 vergoed wordt en de gewone pil niet. Er is, zeker in Frankrijk, een run op een ‘gratis’ pil.

Online bedrijven spelen mogelijk ook een rol. Deze lichten vaak niet goed voor. Eén zo’n bedrijf (met gebrekkige info over Diane op hun website) gaat zelfs zover het twitter account @diane35nieuws te creeeren als dekmantel voor online pillenverkoop.

Wat nu?

Hoewel de risico’s van Diane-35 allang bekend waren en gering lijken te zijn, en bovendien vergelijkbaar met die van de 3e en 4e generatie  OAC’s, is er een massaal verzet tegen Diane-35 op gang gekomen, die niet meer te stuiten lijkt. Niet de experts, maar de media en de politiek lijken de discussie te voeren.Erg verwarrend en soms misleidend voor de patiënt.

Mijn inziens is het besluit van de Nederlandse huisartsen, gynecologen en recent ook de dermatologen om Diane-35 voorlopig niet voor te schrijven aan nieuwe patiënten tot de autoriteiten een uitspraak hebben gedaan over de veiligheid***, gezien de huidige onrust, een verstandige.

Wat niet verstandig is om zomaar met de Diane-35 pil te stoppen. Overleg altijd eerst met uw arts wat voor u de beste optie is.

In 1995 heeft een vergelijkbare reactie op waarschuwingen over de tromboserisico’s van bepaalde OAC’s geleid tot een ware “pil scare”: vrouwen gingen massaal over op een andere pil of stopten er in het geheel mee. Gevolg: een piek aan ongewenste zwangerschappen (met overigens een veel hogere kans op trombose) en abortussen. Conclusie destijds [10]:

“The level of risk should, in future, be more carefully assessed and advice more carefully presented in the interests of public health.”

Kennelijk is deze les aan Nederland en Frankrijk voorbijgegaan.

Hoewel ik denk dat Diane-35 maar voor een beperkte groep echt zinvol is boven de bestaande middelen, is het te betreuren dat op basis van ongefundeerde reacties, patiënten straks mogelijk zelf geen keuzevrijheid meer hebben. Mogen zij zelf de balans tussen voor-en nadelen bepalen?

Het is begrijpelijk (maar misschien niet zo heel professioneel), dat dermatologen nogal gefrustreerd reageren, nu een bepaalde groep patienten tussen wal en schip raakt. Tevens moet men niet op basis van evidence en argumenten, maar onder druk van media en politiek, tot een ander beleid overgaan.

11-3-2013 23-27-37 reactie dermatologen 2

Want laten we wel wezen, sommige dermatologische en gynecologische patiënten hebben wel baat bij Diane-35.

en

En tot slot een prachtige reactie van een acne-patiënte op een  blog post van Ivan Wolfers. Zij vat de essentie in enkele zinnen samen. Net als bovenstaande dames, een patient die zeer weloverwogen met haar arts beslissingen neemt op basis van de bestaande info.

Zoals het zou moeten…

12-3-2013 0-57-27 reactie patient

Noten

* Diane-35 wordt geproduceerd door Bayer. Het staat ook bekend als Minerva, Elisa en in buitenland bijvoorbeels als Dianette. Er zijn verder ook veel merkloze preparaten met dezelfde samenstelling.

**Inmiddels heeft zijn er nog 4 dodelijke gevallen na gebruik van Diane-35 in Nederland bijgekomen (Artsennet, 2013-03-11)

***Hopelijk wordt de gewone pil dan ook in de vergelijking meegenomen. Dit is wel zo eerlijk: het gaat immers om een vergelijking.

Referenties 

  • Venous Thromboembolism and Hormone Replacement Therapy – Green-top Guide line 40 (2010) Royal College of Obstetricians and Gynaecologists, 

    2011

  • Helmerhorst F.M. & Rosendaal F.R. (2013). Is an EMA review on hormonal contraception and thrombosis needed?, BMJ (Clinical research ed.), PMID:
  • van Hylckama Vlieg A., Helmerhorst F.M., Vandenbroucke J.P., Doggen C.J.M. & Rosendaal F.R. (2009). The venous thrombotic risk of oral contraceptives, effects of oestrogen dose and progestogen type: results of the MEGA case-control study., BMJ (Clinical research ed.), PMID:
  • Spitzer W.O. (2003) Cyproterone acetate with ethinylestradiol as a risk factor for venous thromboembolism: an epidemiological evaluation., Journal of obstetrics and gynaecology Canada : JOGC = Journal d’obstétrique et gynécologie du Canada : JOGC, PMID:
  • Martínez F., Ramírez I., Pérez-Campos E., Latorre K. & Lete I. (2012) Venous and pulmonary thromboembolism and combined hormonal contraceptives. Systematic review and meta-analysis., The European journal of contraception & reproductive health care : the official journal of the European Society of Contraception, PMID:
  • NHG-Standaard Anticonceptie 2010 Anke Brand, Anita Bruinsma, Kitty van Groeningen, Sandra Kalmijn, Ineke Kardolus, Monique Peerden, Rob Smeenk, Suzy de Swart, Miranda Kurver, Lex Goudswaard.

  • Cahill D. (2009). PCOS., Clinical evidence, PMID:
  • Arowojolu A.O., Gallo M.F., Lopez L.M. & Grimes D.A. (2012). Combined oral contraceptive pills for treatment of acne., Cochrane database of systematic reviews (Online), PMID:
  • Kertzman M.G.M., Smeets J.G.E., Boukes F.S. & Goudswaard A.N. [Summary of the practice guideline ‘Acne’ (second revision) from the Dutch College of General Practitioners]., Nederlands tijdschrift voor geneeskunde, PMID:
  • Richtlijn Acneïforme Dermatosen, © 2010, Nederlandse Vereniging voor Dermatologie en Venereologie (NVDV)
  • Furedi A. The public health implications of the 1995 ‘pill scare’., Human reproduction update, PMID:


Of Mice and Men Again: New Genomic Study Helps Explain why Mouse Models of Acute Inflammation do not Work in Men

25 02 2013

ResearchBlogging.org

This post is update after a discussion at Twitter with @animalevidence who pointed me at a great blog post at Speaking of Research ([19], a repost of [20], highlighting the shortcomings of the current study using just one single inbred strain of mice (C57Bl6)  [2013-02-26]. Main changes are in blue

A recent paper published in PNAS [1] caused quite a stir both inside and outside the scientific community. The study challenges the validity of using mouse models to test what works as a treatment in humans. At least this is what many online news sources seem to conclude: “drug testing may be a waste of time”[2], “we are not mice” [3, 4], or a bit more to the point: mouse models of inflammation are worthless [5, 6, 7].

But basically the current study looks only at one specific area, the area of inflammatory responses that occur in critically ill patients after severe trauma and burns (SIRS, Systemic Inflammatory Response Syndrome). In these patients a storm of events may eventually lead to organ failure and death. It is similar to what may occur after sepsis (but here the cause is a systemic infection).

Furthermore the study only uses one single approach: it compares the gene response patterns in serious human injuries (burns, trauma) and a human model partially mimicking these inflammatory diseases (human healthy volunteers receiving  a low dose endotoxin) with the corresponding three animal models (burns, trauma, endotoxin).

And, as highlighted by Bill Barrington of “Understand Nutrition” [8], the researchers have only tested the gene profiles in one single strain of mice: C57Bl6 (B6 for short). If B6 was the only model used in practice this would be less of a problem. But according to Mark Wanner of the Jackson Laboratory [19, 20]:

 It is now well known that some inbred mouse strains, such as the C57BL/6J (B6 for short) strain used, are resistant to septic shock. Other strains, such as BALB and A/J, are much more susceptible, however. So use of a single strain will not provide representative results.

The results in itself are very clear. The figures show at a glance that there is no correlation whatsoever between the human and B6 mouse expression data.

Seok and 36 other researchers from across the USA  looked at approximately 5500 human genes and their mouse analogs. In humans, burns and traumatic injuries (and to a certain extent the human endotoxin model) triggered the activation of a vast number of genes, that were not triggered in the present C57Bl6 mouse models. In addition the genomic response is longer lasting in human injuries. Furthermore, the top 5 most activated and most suppressed pathways in human burns and trauma had no correlates in mice. Finally, analysis of existing data in the Gene Expression (GEO) Database showed that the lack of correlation between mouse and human studies was also true for other acute inflammatory responses, like sepsis and acute infection.

This is a high quality study with interesting results. However, the results are not as groundbreaking as some media suggest.

As discussed by the authors [1], mice are known to be far more resilient to inflammatory challenge than humans*: a million fold higher dose of endotoxin than the dose causing shock in humans is lethal to mice.* This, and the fact that “none of the 150  candidate agents that progressed to human trials has proved successful in critically ill patients” already indicates that the current approach fails.

[This is not entirely correct the endotoxin/LPS dose in mice is 1000–10,000 times the dose required to induce severe disease with shock in humans [20] and mice that are resilient to endotoxin may still be susceptible to infection. It may well be that the endotoxin response is not a good model for the late effects of  sepsis]

The disappointing trial results have forced many researchers to question not only the usefulness of the current mouse models for acute inflammation [9,10; refs from 11], but also to rethink the key aspects of the human response itself and the way these clinical trials are performed [12, 13, 14]. For instance, emphasis has always been on the exuberant inflammatory reaction, but the subsequent immunosuppression may also be a major contributor to the disease. There is also substantial heterogeneity among patients [1314] that may explain why some patients have a good prognosis and others haven’t. And some of the initially positive results in human trials have not been reproduced in later studies either (benefit of intense glucose control and corticosteroid treatment) [12]. Thus is it fair to blame only the mouse studies?

dick mouse

dick mouse (Photo credit: Wikipedia)

The coverage by some media is grist to the mill of people who think animal studies are worthless anyway. But one cannot extrapolate these findings to other diseases. Furthermore, as referred to above, the researchers have only tested the gene profiles in one single strain of mice: C57Bl6, meaning that “The findings of Seok et al. are solely applicable to the B6 strain of mice in the three models of inflammation they tested. They unduly generalize these findings to mouse models of inflammation in general. [8]”

It is true that animal studies, including rodent studies, have their limitations. But what are the alternatives? In vitro studies are often even more artificial, and direct clinical testing of new compounds in humans is not ethical.

Obviously, the final proof of effectiveness and safety of new treatments can only be established in human trials. No one will question that.

A lot can be said about why animal studies often fail to directly translate to the clinic [15]. Clinical disparities between the animal models and the clinical trials testing the treatment (like in sepsis) are one reason. Other important reasons may be methodological flaws in animal studies (i.e. no randomization, wrong statistics) and publication bias: non-publication of “negative” results appears to be prevalent in laboratory animal research.[1516]. Despite their shortcomings, animal studies and in vitro studies offer a way to examine certain aspects of a process, disease or treatment.

In summary, this study confirms that the existing (C57Bl6) mouse model doesn’t resemble the human situation in the systemic response following acute traumatic injury or sepsis: the genomic response is entirely different, in magnitude, duration and types of changes in expression.

The findings are not new: the shortcomings of the mouse model(s) were long known. It remains enigmatic why the researchers chose only one inbred strain of mice, and of all mice only the B6-strain, which is less sensitive to endotoxin, and only develop acute kidney injury (part of organ failure) at old age (young mice were used) [21]. In this paper from 2009 (!) various reasons are given why the animal models didn’t properly mimic the human disease and how this can be improved. The authors stress that:

the genetically heterogeneous human population should be more accurately represented by outbred mice, reducing the bias found in inbred strains that might contain or lack recessive disease susceptibility loci, depending on selective pressures.” 

Both Bill Barrington [8] and Mark Wanner [18,19] propose the use of “diversity outbred cross or collaborative cross mice that  provide additional diversity.” Indeed, “replicating genetic heterogeneity and critical clinical risk factors such as advanced age and comorbid conditions (..) led to improved models of sepsis and sepsis-induced AKI (acute kidney injury). 

The authors of the PNAS paper suggest that genomic analysis can aid further in revealing which genes play a role in the perturbed immune response in acute inflammation, but it remains to be seen whether this will ultimately lead to effective treatments of sepsis and other forms of acute inflammation.

It also remains to be seen whether comprehensive genomic characterization will be useful in other disease models. The authors suggest for instance,  that genetic profiling may serve as a guide to develop animal models. A shotgun analyses of gene expression of thousands of genes was useful in the present situation, because “the severe inflammatory stress produced a genomic storm affecting all major cellular functions and pathways in humans which led to sufficient perturbations to allow comparisons between the genes in the human conditions and their analogs in the murine models”. But rough analysis of overall expression profiles may give little insight in the usefulness of other animal models, where genetic responses are more subtle.

And predicting what will happen is far less easy that to confirm what is already known….

NOTE: as said the coverage in news and blogs is again quite biased. The conclusion of a generally good Dutch science  news site (the headline and lead suggested that animal models of immune diseases are crap [6]) was adapted after a critical discussion at Twitter (see here and here), and a link was added to this blog post). I wished this occurred more often….
In my opinion the most balanced summaries can be found at the science-based blogs: ScienceBased Medicine [11] and NIH’s Director’s Blog [17], whereas “Understand Nutrition” [8] has an original point of view, which is further elaborated by Mark Wanner at Speaking of Research [19] and Genetics and your health Blog [20]

References

  1. Seok, J., Warren, H., Cuenca, A., Mindrinos, M., Baker, H., Xu, W., Richards, D., McDonald-Smith, G., Gao, H., Hennessy, L., Finnerty, C., Lopez, C., Honari, S., Moore, E., Minei, J., Cuschieri, J., Bankey, P., Johnson, J., Sperry, J., Nathens, A., Billiar, T., West, M., Jeschke, M., Klein, M., Gamelli, R., Gibran, N., Brownstein, B., Miller-Graziano, C., Calvano, S., Mason, P., Cobb, J., Rahme, L., Lowry, S., Maier, R., Moldawer, L., Herndon, D., Davis, R., Xiao, W., Tompkins, R., , ., Abouhamze, A., Balis, U., Camp, D., De, A., Harbrecht, B., Hayden, D., Kaushal, A., O’Keefe, G., Kotz, K., Qian, W., Schoenfeld, D., Shapiro, M., Silver, G., Smith, R., Storey, J., Tibshirani, R., Toner, M., Wilhelmy, J., Wispelwey, B., & Wong, W. (2013). Genomic responses in mouse models poorly mimic human inflammatory diseases Proceedings of the National Academy of Sciences DOI: 10.1073/pnas.1222878110
  2. Drug Testing In Mice May Be a Waste of Time, Researchers Warn 2013-02-12 (science.slashdot.org)
  3. Susan M Love We are not mice 2013-02-14 (Huffingtonpost.com)
  4. Elbert Chu  This Is Why It’s A Mistake To Cure Mice Instead Of Humans 2012-12-20(richarddawkins.net)
  5. Derek Low. Mouse Models of Inflammation Are Basically Worthless. Now We Know. 2013-02-12 (pipeline.corante.com)
  6. Elmar Veerman. Waardeloos onderzoek. Proeven met muizen zeggen vrijwel niets over ontstekingen bij mensen. 2013-02-12 (wetenschap24.nl)
  7. Gina Kolata. Mice Fall Short as Test Subjects for Humans’ Deadly Ills. 2013-02-12 (nytimes.com)

  8. Bill Barrington. Are Mice Reliable Models for Human Disease Studies? 2013-02-14 (understandnutrition.com)
  9. Raven, K. (2012). Rodent models of sepsis found shockingly lacking Nature Medicine, 18 (7), 998-998 DOI: 10.1038/nm0712-998a
  10. Nemzek JA, Hugunin KM, & Opp MR (2008). Modeling sepsis in the laboratory: merging sound science with animal well-being. Comparative medicine, 58 (2), 120-8 PMID: 18524169
  11. Steven Novella. Mouse Model of Sepsis Challenged 2013-02-13 (http://www.sciencebasedmedicine.org/index.php/mouse-model-of-sepsis-challenged/)
  12. Wiersinga WJ (2011). Current insights in sepsis: from pathogenesis to new treatment targets. Current opinion in critical care, 17 (5), 480-6 PMID: 21900767
  13. Khamsi R (2012). Execution of sepsis trials needs an overhaul, experts say. Nature medicine, 18 (7), 998-9 PMID: 22772540
  14. Hotchkiss RS, Coopersmith CM, McDunn JE, & Ferguson TA (2009). The sepsis seesaw: tilting toward immunosuppression. Nature medicine, 15 (5), 496-7 PMID: 19424209
  15. van der Worp, H., Howells, D., Sena, E., Porritt, M., Rewell, S., O’Collins, V., & Macleod, M. (2010). Can Animal Models of Disease Reliably Inform Human Studies? PLoS Medicine, 7 (3) DOI: 10.1371/journal.pmed.1000245
  16. ter Riet, G., Korevaar, D., Leenaars, M., Sterk, P., Van Noorden, C., Bouter, L., Lutter, R., Elferink, R., & Hooft, L. (2012). Publication Bias in Laboratory Animal Research: A Survey on Magnitude, Drivers, Consequences and Potential Solutions PLoS ONE, 7 (9) DOI: 10.1371/journal.pone.0043404
  17. Dr. Francis Collins. Of Mice, Men and Medicine 2013-02-19 (directorsblog.nih.gov)
  18. Tom/ Mark Wanner Why mice may succeed in research when a single mouse falls short (2013-02-15) (speakingofresearch.com) [repost, with introduction]
  19. Mark Wanner Why mice may succeed in research when a single mouse falls short (2013-02-13/) (http://community.jax.org) %5Boriginal post]
  20. Warren, H. (2009). Editorial: Mouse models to study sepsis syndrome in humans Journal of Leukocyte Biology, 86 (2), 199-201 DOI: 10.1189/jlb.0309210
  21. Doi, K., Leelahavanichkul, A., Yuen, P., & Star, R. (2009). Animal models of sepsis and sepsis-induced kidney injury Journal of Clinical Investigation, 119 (10), 2868-2878 DOI: 10.1172/JCI39421


BAD Science or BAD Science Journalism? – A Response to Daniel Lakens

10 02 2013

ResearchBlogging.orgTwo weeks ago  there was a hot debate among Dutch Tweeps on “bad science, bad science journalism and bad science communication“. This debate was started and fueled by different Dutch blog posts on this topic.[1,4-6]

A controversial post, with both fierce proponents and fierce opposition was the post by Daniel Lakens [1], an assistant professor in Applied Cognitive Psychology.

I was among the opponents. Not because I don’t like a new fresh point of view, but because of a wrong reasoning and because Daniel continuously compares apples and oranges.

Since Twitter debates can’t go in-depth and lack structure and since I cannot comment to his Google sites blog, I pursue my discussion here.

The title of Daniels post is (freely translated, like the rest of his post):

Is this what one calls good science?” 

In his post he criticizes a Dutch science journalist, Hans van Maanen, and specifically his recent column [2], where Hans discusses a paper published in Pediatrics [3].

This longitudinal study tested the Music Marker theory among 309 Dutch kids. The researchers gathered information about the kids’ favorite types of music and tracked incidents of “minor delinquency”, such as shoplifting or vandalism, from the time they were 12 until they reached age 16 [4]. The researchers conclude that liking music that goes against the mainstream (rock, heavy metal, gothic, punk, African American music, and electronic dance music) at age 12 is a strong predictor of future minor delinquency at 16, in contrast to chart pop, classic music, jazz.

The University press office send out a press release [5 ], which was picked up by news media [4,6] and one of the Dutch authors of this study,  Loes Keijsers,  tweeted enthusiastically: “Want to know whether a 16 year old adult will suffer from delinquency, than look at his music taste at age 12!”

According to Hans, Loes could have easily broadcasted (more) balanced tweets, likeMusic preference doesn’t predict shoplifting” or “12 year olds who like Bach keep quiet about shoplifting when 16.” But even then, Hans argues, the tweets wouldn’t have been scientifically underpinned either.

In column style Hans explains why he thinks that the study isn’t methodologically strong: no absolute numbers are given; 7 out of 11 (!) music styles are positively associated with delinquency, but these correlations are not impressive: the strongest predictor (Gothic music preference) can explain no more than 9%  of the variance in delinquent behaviour, which can include anything from shoplifting, vandalism, fighting, graffiti spraying, switching price tags.  Furthermore the risks of later “delinquent” behavior are small:  on a scale 1 (never) to 4 (4 times or more) the mean risk was 1,12. Hans also wonders whether it is a good idea to monitor kids with a certain music taste.

Thus Hans concludesthis study isn’t good science”. Daniel, however, concludes that Hans’ writing is not good science journalism.

First Daniel recalls he and other PhD’s took a course on how to peer review scientific papers. On basis of their peer review of a (published) article 90% of the students decided to reject it. The two main lessons learned by Daniel were:

  • It is easy to critize a scientific paper and grind it down. No single contribution to science (no single article) is perfect.
  • New scientific insights, although imperfect, are worth sharing, because they help to evolve science. *¹

According to Daniel science jounalists often make the same mistakes as the peer reviewing PhD-students: critisizing the individuel studies without a “meta-view” on science.

Peer review and journalism however are different things (apples and oranges if you like).

Peer review (with all its imperfections) serves to filter, check and to improve the quality of individual scientific papers (usually) before they are published  [10]. My papers that passed peer review, were generally accepted. Of course there were the negative reviewers, often  the ignorant ones, and the naggers, but many reviewers had critique that helped to improve my paper, sometimes substantially. As a peer reviewer myself I only try to separate the wheat from the chaff and to enhance the quality of the papers that pass.

Science journalism also has a filter function: it filters already peer reviewed scientific papers* for its readership, “the public” by selecting novel relevant science and translating the scientific, jargon-laded language, into language readers can understand and appreciate. Of course science journalists should put the publication into perspective (call it “meta”).

Surely the PhD-students finger exercise resembles the normal peer review process as much as peer review resembles science journalism.

I understand that pure nitpicking seldom serves a goal, but this rarely occurs in science journalism. The opposite, however, is commonplace.

Daniel disapproves Hans van Maanen’s criticism, because Hans isn’t “meta” enough. Daniel: “Arguing whether an effect size is small or mediocre is nonsense, because no individual study gives a good estimate of the effect size. You need to do more research and combine the results in a meta-analysis”.

Apples and oranges again.

Being “meta” has little to do with meta-analysis. Being meta is … uh … pretty meta. You could think of it as seeing beyond (meta) the findings of one single study*.

A meta-analysis, however, is a statistical technique for combining the findings from independent, but comparable (homogeneous) studies in order to more powerfully estimate the true effect size (pretty exact). This is an important, but difficult methodological task for a scientist, not a journalist. If a meta-analysis on the topic exist, journalists should take this into account, of course (and so should the researchers). If not, they should put the single study in broader perspective (what does the study add to existing knowledge?) and show why this single study is or is not well done?

Daniel takes this further by stating that “One study is no study” and that journalists who simply echo the press releases of a study ànd journalists who just amply criticizes only single publication (like Hans) are clueless about science.

Apples and oranges! How can one lump science communicators (“media releases”), echoing journalists (“the media”) and critical journalists together?

I see more value in a critical analysis than a blind rejoicing of hot air. As long as the criticism guides the reader to appreciate the study.

And if there is just one single novel study, that seems important enough to get media attention, shouldn’t we judge the research on its own merits?

Then Daniel asks himself: “If I do criticize those journalists, shouldn’t I criticize those scientists who published just a single study and wrote a press release about it? “

His conclusion? “No”.

Daniel explains: science never provides absolute certainty, at the most the evidence is strong enough to state what is likely true. This can only be achieved by a lot of research by different investigators. 

Therefore you should believe in your ideas and encourage other scientists to pursue your findings. It doesn’t help when you say that music preference doesn’t predict shoplifting. It does help when you use the media to draw attention to your research. Many researchers are now aware of the “Music Marker Theory”. Thus the press release had its desired effect. By expressing a firm belief in their conclusions, they encourage other scientists to spend their sparse time on this topic. These scientists will try to repeat and falsify the study, an essential step in Cumulative Science. At a time when science is under pressure, scientists shouldn’t stop writing enthusiastic press releases or tweets. 

The latter paragraph is sheer nonsense!

Critical analysis of one study by a journalist isn’t what undermines the  public confidence in science. Rather it’s the media circus, that blows the implications of scientific findings out of proportion.

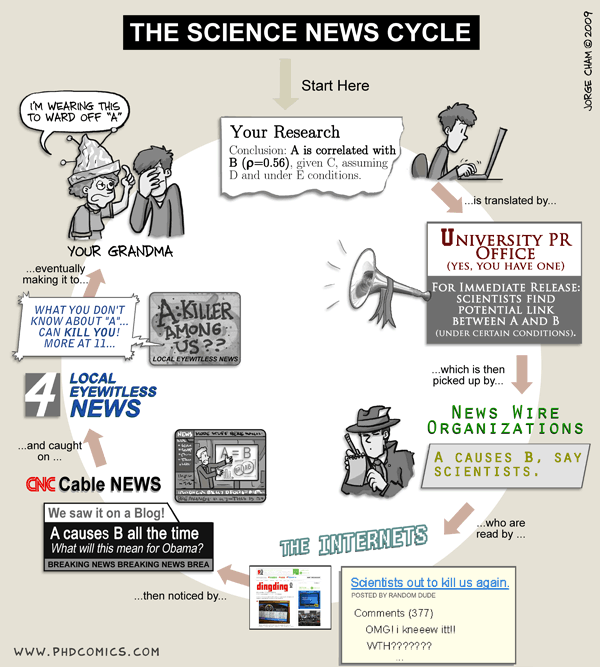
As exemplified by the hilarious PhD Comic below research results are propagated by PR (science communication), picked up by media, broadcasted, spread via the internet. At the end of the cycle conclusions are reached, that are not backed up by (sufficient) evidence.

PhD Comics – The news Cycle

Daniel is right about some things. First one study is indeed no study, in the sense that concepts are continuously tested and corrected: falsification is a central property of science (Popper). He is also right that science doesn’t offer absolute certainty (an aspect that is often not understood by the public). And yes, researchers should believe in their findings and encourage other scientists to check and repeat their experiments.

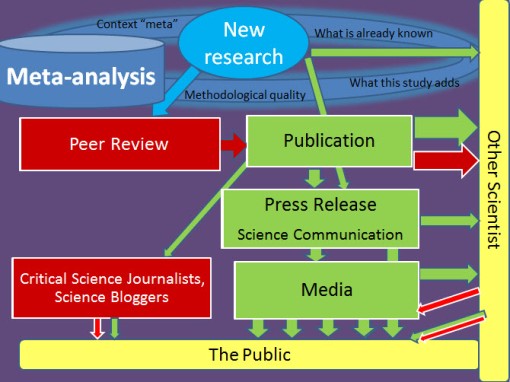
Though not primarily via the media. But via the normal scientific route. Good scientists will keep track of new findings in their field anyway. Suppose that only findings that are trumpeted in the media would be pursued by other scientists?

7-2-2013 23-26-31 media & science

And authors shouldn’t make overstatements. They shouldn’t raise expectations to a level which cannot be met. The Dutch study only shows weak associations. It simply isn’t true that the Dutch study allows us to “predict” at an individual level if a 12 year old will “act out” at 16.

This doesn’t help lay-people to understand the findings and to appreciate science.

The idea that media should just serve to spotlight a paper, seems objectionable to me.

Going back to the meta-level: what about the role of science communicators, media, science journalists and researchers?

According to Maarten Keulemans, journalist, we should just get rid of all science communicators as a layer between scientists and journalists [7]. But Michel van Baal [9] and Roy Meijer[8] have a point when they say that  journalists do a lot PR-ing too and they should do better than to rehash news releases.*²

Now what about Daniel criticism of van Maanen? In my opinion, van Maanen is one of those rare critical journalists who serve as an antidote against uncritical media diarrhea (see Fig above). Comparable to another lone voice in the media: Ben Goldacre. It didn’t surprise me that Daniel didn’t approve of him (and his book Bad Science) either [11]. 

Does this mean that I find Hans van Maanen a terrific science journalist? No, not really. I often agree with him (i.e. see this post [12]). He is one of those rare journalists who has real expertise in research methodology . However, his columns don’t seem to be written for a large audience: they seem too complex for most lay people. One thing I learned during a scientific journalism course, is that one should explain all jargon to one’s audience.

Personally I find this critical Dutch blog post[13] about the Music Marker Theory far more balanced. After a clear description of the study, Linda Duits concludes that the results of the study are pretty obvious, but that the the mini-hype surrounding this research is caused by the positive tone of the press release. She stresses that prediction is not predetermination and that the musical genres are not important: hiphop doesn’t lead to criminal activity and metal not to vandalism.

And this critical piece in Jezebel [14],  reaches far more people by talking in plain, colourful language, hilarious at times.

It also a swell title: “Delinquents Have the Best Taste in Music”. Now that is an apt conclusion!

———————-

*¹ Since Daniel doesn’t refer to  open (trial) data access nor the fact that peer review may , I ignore these aspects for the sake of the discussion.

*² Coincidence? Keulemans has covered  the music marker study quite uncritically (positive).

Photo Credits

http://www.phdcomics.com/comics/archive.php?comicid=1174

References

  1. Daniel Lakens: Is dit nou goede Wetenschap? – Jan 24, 2013 (sites.google.com/site/lakens2/blog)
  2. Hans van Maanen: De smaak van boefjes in de dop,De Volkskrant, Jan 12, 2013 (vanmaanen.org/hans/columns/)
  3. ter Bogt, T., Keijsers, L., & Meeus, W. (2013). Early Adolescent Music Preferences and Minor Delinquency PEDIATRICS DOI: 10.1542/peds.2012-0708
  4. Lindsay Abrams: Kids Who Like ‘Unconventional Music’ More Likely to Become Delinquent, the Atlantic, Jan 18, 2013
  5. Muziekvoorkeur belangrijke voorspeller voor kleine criminaliteit. Jan 8, 2013 (pers.uu.nl)
  6. Maarten Keulemans: Muziek is goede graadmeter voor puberaal wangedrag – De Volkskrant, 12 januari 2013  (volkskrant.nl)
  7. Maarten Keulemans: Als we nou eens alle wetenschapscommunicatie afschaffen? – Jan 23, 2013 (denieuwereporter.nl)
  8. Roy Meijer: Wetenschapscommunicatie afschaffen, en dan? – Jan 24, 2013 (denieuwereporter.nl)
  9. Michel van Baal. Wetenschapsjournalisten doen ook aan PR – Jan 25, 2013 ((denieuwereporter.nl)
  10. What peer review means for science (guardian.co.uk)
  11. Daniel Lakens. Waarom raadde Maarten Keulemans me Bad Science van Goldacre aan? Oct 25, 2012
  12. Why Publishing in the NEJM is not the Best Guarantee that Something is True: a Response to Katan – Sept 27, 2012 (laikaspoetnik.wordpress.com)
  13. Linda Duits: Debunk: worden pubers crimineel van muziek? (dieponderzoek.nl)
  14. Lindy west: Science: “Delinquents Have the Best Taste in Music” (jezebel.com)


Why Publishing in the NEJM is not the Best Guarantee that Something is True: a Response to Katan

27 10 2012

ResearchBlogging.orgIn a previous post [1] I reviewed a recent  Dutch study published in the New England Journal of Medicine (NEJM [2] about the effects of sugary drinks on the body mass index of school children.

The study got widely covered by the media. The NRC, for which the main author Martijn Katan works as a science columnist,  columnist, spent  two full (!) pages on the topic -with no single critical comment-[3].
As if this wasn’t enough, the latest column of Katan again dealt with his article (text freely available at mkatan.nl)[4].

I found Katan’s column “Col hors Catégorie” [4] quite arrogant, especially because he tried to belittle a (as he called it) “know-it-all” journalist who criticized his work  in a rivaling newspaper. This wasn’t fair, because the journalist had raised important points [5, 1] about the work.

The piece focussed on the long road of getting papers published in a top journal like the NEJM.
Katan considers the NEJM as the “Tour de France” among  medical journals: it is a top achievement to publish in this paper.

Katan also states that “publishing in the NEJM is the best guarantee something is true”.

I think the latter statement is wrong for a number of reasons.*

  1. First, most published findings are false [6]. Thus journals can never “guarantee”  that published research is true.
    Factors that  make it less likely that research findings are true include a small effect size,  a greater number and lesser preselection of tested relationships, selective outcome reporting, the “hotness” of the field (all applying more or less to Katan’s study, he also changed the primary outcomes during the trial[7]), a small study, a great financial interest and a low pre-study probability (not applicable) .
  2. It is true that NEJM has a very high impact factor. This is  a measure for how often a paper in that journal is cited by others. Of course researchers want to get their paper published in a high impact journal. But journals with high impact factors often go for trendy topics and positive results. In other words it is far more difficult to publish a good quality study with negative results, and certainly in an English high impact journal. This is called publication bias (and language bias) [8]. Positive studies will also be more frequently cited (citation bias) and will more likely be published more than once (multiple publication bias) (indeed, Katan et al already published about the trial [9], and have not presented all their data yet [1,7]). All forms of bias are a distortion of the “truth”.
    (This is the reason why the search for a (Cochrane) systematic review must be very sensitive [8] and not restricted to core clinical journals, but even include non-published studies: for these studies might be “true”, but have failed to get published).
  3. Indeed, the group of Ioannidis  just published a large-scale statistical analysis[10] showing that medical studies revealing “very large effects” seldom stand up when other researchers try to replicate them. Often studies with large effects measure laboratory and/or surrogate markers (like BMI) instead of really clinically relevant outcomes (diabetes, cardiovascular complications, death)
  4. More specifically, the NEJM does regularly publish studies about pseudoscience or bogus treatments. See for instance this blog post [11] of ScienceBased Medicine on Acupuncture Pseudoscience in the New England Journal of Medicine (which by the way is just a review). A publication in the NEJM doesn’t guarantee it isn’t rubbish.
  5. Importantly, the NEJM has the highest proportion of trials (RCTs) with sole industry support (35% compared to 7% in the BMJ) [12] . On several occasions I have discussed these conflicts of interests and their impact on the outcome of studies ([13, 14; see also [15,16] In their study, Gøtzsche and his colleagues from the Nordic Cochrane Centre [12] also showed that industry-supported trials were more frequently cited than trials with other types of support, and that omitting them from the impact factor calculation decreased journal impact factors. The impact factor decrease was even 15% for NEJM (versus 1% for BMJ in 2007)! For the journals who provided data, income from the sales of reprints contributed to 3% and 41% of the total income for BMJ and The Lancet.
    A recent study, co-authored by Ben Goldacre (MD & science writer) [17] confirms that  funding by the pharmaceutical industry is associated with high numbers of reprint ordersAgain only the BMJ and the Lancet provided all necessary data.
  6. Finally and most relevant to the topic is a study [18], also discussed at Retractionwatch[19], showing that  articles in journals with higher impact factors are more likely to be retracted and surprise surprise, the NEJM clearly stands on top. Although other reasons like higher readership and scrutiny may also play a role [20], it conflicts with Katan’s idea that  “publishing in the NEJM is the best guarantee something is true”.

I wasn’t aware of the latter study and would like to thank drVes and Ivan Oranski for responding to my crowdsourcing at Twitter.

References

  1. Sugary Drinks as the Culprit in Childhood Obesity? a RCT among Primary School Children (laikaspoetnik.wordpress.com)
  2. de Ruyter JC, Olthof MR, Seidell JC, & Katan MB (2012). A trial of sugar-free or sugar-sweetened beverages and body weight in children. The New England journal of medicine, 367 (15), 1397-406 PMID: 22998340
  3. NRC Wim Köhler Eén kilo lichter.NRC | Zaterdag 22-09-2012 (http://archief.nrc.nl/)
  4. Martijn Katan. Col hors Catégorie [Dutch], (published in de NRC,  (20 oktober)(www.mkatan.nl)
  5. Hans van Maanen. Suiker uit fris, De Volkskrant, 29 september 2012 (freely accessible at http://www.vanmaanen.org/)
  6. Ioannidis, J. (2005). Why Most Published Research Findings Are False PLoS Medicine, 2 (8) DOI: 10.1371/journal.pmed.0020124
  7. Changes to the protocol http://clinicaltrials.gov/archive/NCT00893529/2011_02_24/changes
  8. Publication Bias. The Cochrane Collaboration open learning material (www.cochrane-net.org)
  9. de Ruyter JC, Olthof MR, Kuijper LD, & Katan MB (2012). Effect of sugar-sweetened beverages on body weight in children: design and baseline characteristics of the Double-blind, Randomized INtervention study in Kids. Contemporary clinical trials, 33 (1), 247-57 PMID: 22056980
  10. Pereira, T., Horwitz, R.I., & Ioannidis, J.P.A. (2012). Empirical Evaluation of Very Large Treatment Effects of Medical InterventionsEvaluation of Very Large Treatment Effects JAMA: The Journal of the American Medical Association, 308 (16) DOI: 10.1001/jama.2012.13444
  11. Acupuncture Pseudoscience in the New England Journal of Medicine (sciencebasedmedicine.org)
  12. Lundh, A., Barbateskovic, M., Hróbjartsson, A., & Gøtzsche, P. (2010). Conflicts of Interest at Medical Journals: The Influence of Industry-Supported Randomised Trials on Journal Impact Factors and Revenue – Cohort Study PLoS Medicine, 7 (10) DOI: 10.1371/journal.pmed.1000354
  13. One Third of the Clinical Cancer Studies Report Conflict of Interest (laikaspoetnik.wordpress.com)
  14. Merck’s Ghostwriters, Haunted Papers and Fake Elsevier Journals (laikaspoetnik.wordpress.com)
  15. Lexchin, J. (2003). Pharmaceutical industry sponsorship and research outcome and quality: systematic review BMJ, 326 (7400), 1167-1170 DOI: 10.1136/bmj.326.7400.1167
  16. Smith R (2005). Medical journals are an extension of the marketing arm of pharmaceutical companies. PLoS medicine, 2 (5) PMID: 15916457 (free full text at PLOS)
  17. Handel, A., Patel, S., Pakpoor, J., Ebers, G., Goldacre, B., & Ramagopalan, S. (2012). High reprint orders in medical journals and pharmaceutical industry funding: case-control study BMJ, 344 (jun28 1) DOI: 10.1136/bmj.e4212
  18. Fang, F., & Casadevall, A. (2011). Retracted Science and the Retraction Index Infection and Immunity, 79 (10), 3855-3859 DOI: 10.1128/IAI.05661-11
  19. Is it time for a Retraction Index? (retractionwatch.wordpress.com)
  20. Agrawal A, & Sharma A (2012). Likelihood of false-positive results in high-impact journals publishing groundbreaking research. Infection and immunity, 80 (3) PMID: 22338040

——————————————–

* Addendum: my (unpublished) letter to the NRC

Tour de France.
Nadat het NRC eerder 2 pagina’ s de loftrompet over Katan’s nieuwe studie had afgestoken, vond Katan het nodig om dit in zijn eigen column dunnetjes over te doen. Verwijzen naar je eigen werk mag, ook in een column, maar dan moeten wij daar als lezer wel wijzer van worden. Wat is nu de boodschap van dit stuk “Col hors Catégorie“? Het beschrijft vooral de lange weg om een wetenschappelijke studie gepubliceerd te krijgen in een toptijdschrift, in dit geval de New England Journal of Medicine (NEJM), “de Tour de France onder de medische tijdschriften”. Het stuk eindigt met een tackle naar een journalist “die dacht dat hij het beter wist”. Maar ach, wat geeft dat als de hele wereld staat te jubelen? Erg onsportief, omdat die journalist (van Maanen, Volkskrant) wel degelijk op een aantal punten scoorde. Ook op Katan’s kernpunt dat een NEJM-publicatie “de beste garantie is dat iets waar is” valt veel af te dingen. De NEJM heeft inderdaad een hoge impactfactor, een maat voor hoe vaak artikelen geciteerd worden. De NEJM heeft echter ook de hoogste ‘artikelterugtrekkings’ index. Tevens heeft de NEJM het hoogste percentage door de industrie gesponsorde klinische trials, die de totale impactfactor opkrikken. Daarnaast gaan toptijdschriften vooral voor “positieve resultaten” en “trendy onderwerpen”, wat publicatiebias in de hand werkt. Als we de vergelijking met de Tour de France doortrekken: het volbrengen van deze prestigieuze wedstrijd garandeert nog niet dat deelnemers geen verboden middelen gebruikt hebben. Ondanks de strenge dopingcontroles.


Sugary Drinks as the Culprit in Childhood Obesity? a RCT among Primary School Children

24 09 2012

ResearchBlogging.org Childhood obesity is a growing health problem. Since 1980, the proportion of overweighted children has almost tripled in the USA:  nowadays approximately 17% of children and adolescents are obese.  (Source: cdc.gov [6])

Common sense tells me that obesity is the result of too high calory intake without sufficient physical activity.” which is just what the CDC states. I’m not surprised that the CDC also mentions the greater availability of high-energy-dense foods and sugary drinks at home and at school as main reasons for the increased intake of calories among children.

In my teens I already realized that sugar in sodas were just “empty calories” and I replaced tonic and cola by low calory  Rivella (and omitted sugar from tea). When my children were young I urged the day care to restrain from routinely giving lemonade (often in vain).

I was therefore a bit surprised to notice all the fuss in the Dutch newspapers [NRC] [7] about a new Dutch study [1] showing that sugary drinks contributed to obesity. My first reaction was “Duhhh?!…. so what?”.

Also, it bothered me that the researchers had performed a RCT (randomized controlled trial) in kids giving one half of them sugar-sweetened drinks and the other half sugar-free drinks. “Is it ethical to perform such a scientific “experiment” in healthy kids?”, I wondered, “giving more than 300 kids 14 kilo sugar over 18 months, without them knowing it?”

But reading the newspaper and the actual paper[1], I found that the study was very well thought out. Also ethically.

It is true that the association between sodas and weight gain has been shown before. But these studies were either observational studies, where one cannot look at the effect of sodas in isolation (kids who drink a lot of sodas often eat more junk food and watch more television: so these other life style aspects may be the real culprit) or inconclusive RCT’s (i.e. because of low sample size). Weak studies and inconclusive evidence will not convince policy makers, organizations and beverage companies (nor schools) to take action.

As explained previously in The Best Study Design… For Dummies [8] the best way to test whether an intervention has a health effect is to do a  double blind RCT, where the intervention (in this case: sugary drinks) is compared to a control (drinks with artificial sweetener instead of sugar) and where the study participants, and direct researchers do not now who receives the  actual intervention and who the phony one.

The study of Katan and his group[1] was a large, double blinded RCT with a long follow-up (18 months). The researchers recruited 641 normal-weight schoolchildren from 8 primary schools.

Importantly, only children were included in the study that normally drank sugared drinks at school (see announcement in Dutch). Thus participation in the trial only meant that half of the children received less sugar during the study-period. The researchers would have preferred drinking water as a control, but to ensure that the sugar-free and sugar-containing drinks tasted and looked essentially the same they used an artificial sweetener as a control.

The children drank 8 ounces (250 ml) of a 104-calorie sugar-sweetened or no-calorie sugar-free fruit-flavoured drink every day during 18 months.  Compliance was good as children who drank the artificially sweetened beverages had the expected level of urinary sucralose (sweetener).

At the end of the study the kids in the sugar-free group gained a kilo less weight than their peers. They also had a significant lower BMI-increase and gained less body fat.

Thus, according to Katan in the Dutch newspaper NRC[7], “it is time to get rid of the beverage vending machines”. (see NRC [6]).

But does this research really support that conclusion and does it, as some headlines state [9]: “powerfully strengthen the case against soda and other sugary drinks as culprits in the obesity epidemic?”

Rereading the paper I wondered as to the reasons why this study was performed.

If the trial was meant to find out whether putting children on artificially sweetened beverages (instead of sugary drinks) would lead to less fat gain, then why didn’t the researchers do an  intention to treat (ITT) analysis? In an ITT analysis trial participants are compared–in terms of their final results–within the groups to which they were initially randomized. This permits the pragmatic evaluation of the benefit of a treatment policy.
Suppose there were more dropouts in the intervention group, that might indicate that people had a reason not to adhere to the treatment. Indeed there were many dropouts overall: 26% of the children had stopped consuming the drinks, 29% from the sugar-free group, and 22% from the sugar group.
Interestingly, the majority of the children who stopped drinking the cans because they no longer liked the drink (68/94 versus 45/70 dropouts in the sugar-free versus the sugar group).
Ànd children who correctly assumed that the sweetened drinks were “artificially sweetened” was 21% higher than expected by chance (correct identification was 3% lower in the sugar group).
Did some children stop using the non-sugary drinks because they found the taste less nice than usual or artificial? Perhaps.

This  might indicate that replacing sugar-drinks by artificially sweetened drinks might not be as effective in “practice”.

Indeed most of the effect on the main outcome, the differences in BMI-Z score (the number of standard deviations by which a child differs from the mean in the Netherland for his or her age or sex) was “strongest” after 6 months and faded after 12 months.

Mind you, the researchers did neatly correct for the missing data by multiple imputation. As long as the children participated in the study, their changes in body weight and fat paralleled those of children who finished the study. However, the positive effect of the earlier use of non-sugary drinks faded in children who went back to drinking sugary drinks. This is not unexpected, but it underlines the point I raised above: the effect may be less drastic in the “real world”.

Another (smaller) RCT, published in the same issue of the NEJM [2](editorial in[4]), aimed to test the effect of an intervention to cut the intake of sugary drinks in obese adolescents. The intervention (home deliveries of bottled water and diet drinks for one year) led to a significant reduction in mean BMI (body mass index), but not in percentage body fat, especially in Hispanic adolescents. However at one year follow up (thus one year after the intervention had stopped) the differences between the groups evaporated again.

But perhaps the trial was “just” meant as a biological-fysiological experiment, as Hans van Maanen suggested in his critical response in de Volkskrant[10].

Indeed, the data actually show that sugar in drinks can lead to a greater increase in obesity-related parameters (and vice versa). [avoiding the endless fructose-glucose debate [11].

In the media, Katan stresses the mechanistic aspects too. He claims that children who drank the sweetened drinks, didn’t compensate for the lower intake of sugars by eating more. In the NY-times he is cited as follows[12]: “When you change the intake of liquid calories, you don’t get the effect that you get when you skip breakfast and then compensate with a larger lunch…”

This seems a logic explanation, but I can’t find any substatation in the article.

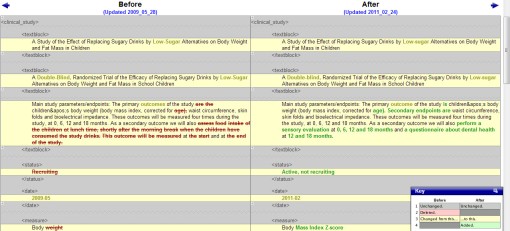
Still “food intake of the children at lunch time, shortly after the morning break when the children have consumed the study drinks”, was a secondary outcome in the original protocol!! (see the nice comparison of the two most disparate descriptions of the trial design at clinicaltrials.gov [5], partly shown in the figure below).

“Energy intake during lunchtime” was later replaced by a “sensory evaluation” (with questions like: “How satiated do you feel?”). The results, however were not reported in their current paper. That is also true for a questionnaire about dental health.

Looking at the two protocol versions I saw other striking differences. At 2009_05_28, the primary outcomes of the study are the children’s body weight (BMI z-score),waist circumference (replaced by waist to height), skin folds and bioelectrical impedance.
The latter three become secondary outcomes in the final draft. Why?

Click to enlarge (source Clinicaltrials.gov [5])

It is funny that although the main outcome is the BMI z score, the authors mainly discuss the effects on body weight and body fat in the media (but perhaps this is better understood by the audience).

Furthermore, the effect on weight is less then expected: 1 kilo instead of 2,3 kilo. And only a part is accounted for by loss in body fat: -0,55 kilo fat as measured by electrical impedance and -0,35 kilo as measured by changes in skinfold thickness. The standard deviations are enormous.

Look for instance at the primary end point (BMI z score) at 0 and 18 months in both groups. The change in this period is what counts. The difference in change between both groups from baseline is -0,13, with a P value of 0.001.

(data are based on the full cohort, with imputed data, taken from Table 2)

Sugar-free group : 0.06±1.00  [0 Mo]  –> 0.08±0.99 [18 Mo] : change = 0.02±0.41  

Sugar-group: 0.01±1.04  [0 Mo]  –> 0.15±1.06 [18 Mo] : change = 0.15±0.42 

Difference in change from baseline: −0.13 (−0.21 to −0.05) P = 0.001

Looking at these data I’m impressed by the standard deviations (replaced by standard errors in the somewhat nicer looking fig 3). What does a value of 0.01 ±1.04 represent? There is a looooot of variation (even though BMI z is corrected for age and sex). Although no statistical differences were found for baseline values between the groups the “eyeball test” tells me the sugar- group has a slight “advantage”. They seem to start with slightly lower baseline values (overall, except for body weight).

Anyway, the changes are significant….. But significance isn’t identical to relevant.

At a second look the data look less impressive than the media reports.

Another important point, raised by van Maanen[10], is that the children’s weight increases more in this study than in the normal Dutch population. 6-7 kilo instead of 3 kilo.

In conclusion, the study by the group of Katan et al is a large, unique, randomized trial, that looked at the effects of replacement of sugar by artificial sweeteners in drinks consumed by healthy school children. An effect was noticed on several “obesity-related parameters”, but the effects were not large and possibly don’t last after discontinuation of the trial.

It is important that a single factor, the sugar component in beverages is tested in isolation. This shows that sugar itself “does matter”. However, the trial does not show that sugary drinks are the main obesity  factor in childhood (as suggested in some media reports).

It is clear that the investigators feel very engaged, they really want to tackle the childhood obesity problem. But they should separate the scientific findings from common sense.

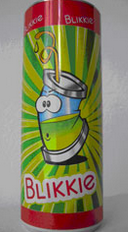
The cans fabricated for this trial were registered under the trade name Blikkie (Dutch for “Little Can”). This was to make sure that the drinks would never be sold by smart business guys using the slogan: “cans which have scientifically been proven to help to keep your child lean and healthy”.[NRC]

Still soft drink stakeholders may well argue that low calory drinks are just fine and that curbing sodas is not the magic bullet.

But it is a good start, I think.

Photo credits Cola & Obesity:  Melliegrunt Flikr [CC]

  1. de Ruyter JC, Olthof MR, Seidell JC, & Katan MB (2012). A Trial of Sugar-free or Sugar-Sweetened Beverages and Body Weight in Children. The New England journal of medicine PMID: 22998340
  2. Ebbeling CB, Feldman HA, Chomitz VR, Antonelli TA, Gortmaker SL, Osganian SK, & Ludwig DS (2012). A Randomized Trial of Sugar-Sweetened Beverages and Adolescent Body Weight. The New England journal of medicine PMID: 22998339
  3. Qi Q, Chu AY, Kang JH, Jensen MK, Curhan GC, Pasquale LR, Ridker PM, Hunter DJ, Willett WC, Rimm EB, Chasman DI, Hu FB, & Qi L (2012). Sugar-Sweetened Beverages and Genetic Risk of Obesity. The New England journal of medicine PMID: 22998338
  4. Caprio S (2012). Calories from Soft Drinks – Do They Matter? The New England journal of medicine PMID: 22998341
  5. Changes to the protocol http://clinicaltrials.gov/archive/NCT00893529/2011_02_24/changes
  6. Overweight and Obesity: Childhood obesity facts  and A growing problem (www.cdc.gov)
  7. NRC Wim Köhler Eén kilo lichter.NRC | Zaterdag 22-09-2012 (http://archief.nrc.nl/)
  8.  The Best Study Design… For Dummies (https://laikaspoetnik.wordpress.com)
  9. Studies point to sugary drinks as culprits in childhood obesity – CTV News (ctvnews.ca)
  10. Hans van Maanen. Suiker uit fris, De Volkskrant, 29 september 2012 (freely accessible at http://www.vanmaanen.org/)
  11. Sugar-Sweetened Beverages, Diet Coke & Health. Part I. (https://laikaspoetnik.wordpress.com)
  12. Roni Caryn Rabina. Avoiding Sugared Drinks Limits Weight Gain in Two Studies. New York Times, September 21, 2012


The Scatter of Medical Research and What to do About it.

18 05 2012

ResearchBlogging.orgPaul Glasziou, GP and professor in Evidence Based Medicine, co-authored a new article in the BMJ [1]. Similar to another paper [2] I discussed before [3] this paper deals with the difficulty for clinicians of staying up-to-date with the literature. But where the previous paper [2,3] highlighted the mere increase in number of research articles over time, the current paper looks at the scatter of randomized clinical trials (RCTs) and systematic reviews (SR’s) accross different journals cited in one year (2009) in PubMed.

Hofmann et al analyzed 7 specialties and 9 sub-specialties, that are considered the leading contributions to the burden of disease in high income countries.

They followed a relative straightforward method for identifying the publications. Each search string consisted of a MeSH term (controlled  term) to identify the selected disease or disorders, a publication type [pt] to identify the type of study, and the year of publication. For example, the search strategy for randomized trials in cardiology was: “heart diseases”[MeSH] AND randomized controlled trial[pt] AND 2009[dp]. (when searching “heart diseases” as a MeSH, narrower terms are also searched.) Meta-analysis[pt] was used to identify systematic reviews.

Using this approach Hofmann et al found 14 343 RCTs and 3214 SR’s published in 2009 in the field of the selected (sub)specialties. There was a clear scatter across journals, but this scatter varied considerably among specialties:

“Otolaryngology had the least scatter (363 trials across 167 journals) and neurology the most (2770 trials across 896 journals). In only three subspecialties (lung cancer, chronic obstructive pulmonary disease, hearing loss) were 10 or fewer journals needed to locate 50% of trials. The scatter was less for systematic reviews: hearing loss had the least scatter (10 reviews across nine journals) and cancer the most (670 reviews across 279 journals). For some specialties and subspecialties the papers were concentrated in specialty journals; whereas for others, few of the top 10 journals were a specialty journal for that area.
Generally, little overlap occurred between the top 10 journals publishing trials and those publishing systematic reviews. The number of journals required to find all trials or reviews was highly correlated (r=0.97) with the number of papers for each specialty/ subspecialty.”

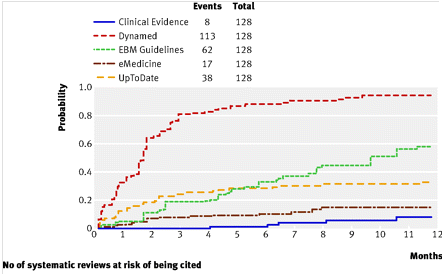
Previous work already suggested that this scatter of research has a long tail. Half of the publications is in a minority of papers, whereas the remaining articles are scattered among many journals (see Fig below).

Click to enlarge en see legends at BMJ 2012;344:e3223 [CC]

The good news is that SRs are less scattered and that general journals appear more often in the top 10 journals publishing SRs. Indeed for 6 of the 7 specialties and 4 of the 9 subspecialties, the Cochrane Database of Systematic Reviews had published the highest number of systematic reviews, publishing between 6% and 18% of all the systematic reviews published in each area in 2009. The bad news is that even keeping up to date with SRs seems a huge, if not impossible, challenge.

In other words, it is not sufficient for clinicians to rely on personal subscriptions to a few journals in their specialty (which is common practice). Hoffmann et al suggest several solutions to help clinicians cope with the increasing volume and scatter of research publications.

  • a central library of systematic reviews (but apparently the Cochrane Library fails to fulfill such a role according to the authors, because many reviews are out of date and are perceived as less clinically relevant)
  • registry of planned and completed systematic reviews, such as prospero. (this makes it easier to locate SRs and reduces bias)
  • Synthesis of Evidence and synopses, like the ACP-Jounal Club which summarizes the best evidence in internal medicine
  • Specialised databases that collate and critically appraise randomized trials and systematic reviews, like www.pedro.org.au for physical therapy. In my personal experience, however, this database is often out of date and not comprehensive
  • Journal scanning services like EvidenceUpdates from mcmaster.ca), which scans over 120 journals, filters articles on the basis of quality, has practising clinicians rate them for relevance and newsworthiness, and makes them available as email alerts and in a searchable database. I use this service too, but besides that not all specialties are covered, the rating of evidence may not always be objective (see previous post [4])
  • The use of social media tools to alert clinicians to important new research.

Most of these solutions are (long) existing solutions that do not or only partly help to solve the information overload.

I was surprised that the authors didn’t propose the use of personalized alerts. PubMed’s My NCBI feature allows to create automatic email alerts on a topic and to subscribe to electronic tables of contents (which could include ACP journal Club). Suppose that a physician browses 10 journals roughly covering 25% of the trials. He/she does not need to read all the other journals from cover to cover to avoid missing one potentially relevant trial. Instead it is far more efficient to perform a topic search to filter relevant studies from journals that seldom publish trials on the topic of interest. One could even use the search of Hoffmann et al to achieve this.* Although in reality, most clinical researchers will have narrower fields of interest than all studies about endocrinology and neurology.

At our library we are working at creating deduplicated, easy to read, alerts that collate table of contents of certain journals with topic (and author) searches in PubMed, EMBASE and other databases. There are existing tools that do the same.

Another way to reduce the individual work (reading) load is to organize journals clubs or even better organize regular CATs (critical appraised topics). In the Netherlands, CATS are a compulsory item for residents. A few doctors do the work for many. Usually they choose topics that are clinically relevant (or for which the evidence is unclear).

The authors shortly mention that their search strategy might have missed  missed some eligible papers and included some that are not truly RCTs or SRs, because they relied on PubMed’s publication type to retrieve RCTs and SRs. For systematic reviews this may be a greater problem than recognized, for the authors have used meta-analyses[pt] to identify systematic reviews. Unfortunately PubMed has no publication type for systematic reviews, but it may be clear that there are many more systematic reviews that meta-analyses. Possibly systematical reviews might even have a different scatter pattern than meta-analyses (i.e. the latter might be preferentially included in core journals).

Furthermore not all meta-analyses and systematic reviews are reviews of RCTs (thus it is not completely fair to compare MAs with RCTs only). On the other hand it is a (not discussed) omission of this study, that only interventions are considered. Nowadays physicians have many other questions than those related to therapy, like questions about prognosis, harm and diagnosis.

I did a little imperfect search just to see whether use of other search terms than meta-analyses[pt] would have any influence on the outcome. I search for (1) meta-analyses [pt] and (2) systematic review [tiab] (title and abstract) of papers about endocrine diseases. Then I subtracted 1 from 2 (to analyse the systematic reviews not indexed as meta-analysis[pt])

Thus:

(ENDOCRINE DISEASES[MESH] AND SYSTEMATIC REVIEW[TIAB] AND 2009[DP]) NOT META-ANALYSIS[PT]

I analyzed the top 10/11 journals publishing these study types.

This little experiment suggests that:

  1. the precise scatter might differ per search: apparently the systematic review[tiab] search yielded different top 10/11 journals (for this sample) than the meta-analysis[pt] search. (partially because Cochrane systematic reviews apparently don’t mention systematic reviews in title and abstract?).
  2. the authors underestimate the numbers of Systematic Reviews: simply searching for systematic review[tiab] already found appr. 50% additional systematic reviews compared to meta-analysis[pt] alone
  3. As expected (by me at last), many of the SR’s en MA’s were NOT dealing with interventions, i.e. see the first 5 hits (out of 108 and 236 respectively).
  4. Together these findings indicate that the true information overload is far greater than shown by Hoffmann et al (not all systematic reviews are found, of all available search designs only RCTs are searched).
  5. On the other hand this indirectly shows that SRs are a better way to keep up-to-date than suggested: SRs  also summarize non-interventional research (the ratio SRs of RCTs: individual RCTs is much lower than suggested)
  6. It also means that the role of the Cochrane Systematic reviews to aggregate RCTs is underestimated by the published graphs (the MA[pt] section is diluted with non-RCT- systematic reviews, thus the proportion of the Cochrane SRs in the interventional MAs becomes larger)

Well anyway, these imperfections do not contradict the main point of this paper: that trials are scattered across hundreds of general and specialty journals and that “systematic reviews” (or meta-analyses really) do reduce the extent of scatter, but are still widely scattered and mostly in different journals to those of randomized trials.

Indeed, personal subscriptions to journals seem insufficient for keeping up to date.
Besides supplementing subscription by  methods such as journal scanning services, I would recommend the use of personalized alerts from PubMed and several prefiltered sources including an EBM search machine like TRIP (www.tripdatabase.com/).

*but I would broaden it to find all aggregate evidence, including ACP, Clinical Evidence, syntheses and synopses, not only meta-analyses.

**I do appreciate that one of the co-authors is a medical librarian: Sarah Thorning.

References

  1. Hoffmann, Tammy, Erueti, Chrissy, Thorning, Sarah, & Glasziou, Paul (2012). The scatter of research: cross sectional comparison of randomised trials and systematic reviews across specialties BMJ, 344 : 10.1136/bmj.e3223
  2. Bastian, H., Glasziou, P., & Chalmers, I. (2010). Seventy-Five Trials and Eleven Systematic Reviews a Day: How Will We Ever Keep Up? PLoS Medicine, 7 (9) DOI: 10.1371/journal.pmed.1000326
  3. How will we ever keep up with 75 trials and 11 systematic reviews a day (laikaspoetnik.wordpress.com)
  4. Experience versus Evidence [1]. Opioid Therapy for Rheumatoid Arthritis Pain. (laikaspoetnik.wordpress.com)


Can Guidelines Harm Patients?

2 05 2012

ResearchBlogging.orgRecently I saw an intriguing “personal view” in the BMJ written by Grant Hutchison entitled: “Can Guidelines Harm Patients Too?” Hutchison is a consultant anesthetist with -as he calls it- chronic guideline fatigue syndrome. Hutchison underwent an acute exacerbation of his “condition” with the arrival of another set of guidelines in his email inbox. Hutchison:

On reviewing the level of evidence provided for the various recommendations being offered, I was struck by the fact that no relevant clinical trials had been carried out in the population of interest. Eleven out of 25 of the recommendations made were supported only by the lowest levels of published evidence (case reports and case series, or inference from studies not directly applicable to the relevant population). A further seven out of 25 were derived only from the expert opinion of members of the guidelines committee, in the absence of any guidance to be gleaned from the published literature.

Hutchison’s personal experience is supported by evidence from two articles [2,3].

One paper published in the JAMA 2009 [2] concludes that ACC/AHA (American College of Cardiology and the American Heart Association) clinical practice guidelines are largely developed from lower levels of evidence or expert opinion and that the proportion of recommendations for which there is no conclusive evidence is growing. Only 314 recommendations of 2711 (median, 11%) are classified as level of evidence A , thus recommendation based on evidence from multiple randomized trials or meta-analyses.  The majority of recommendations (1246/2711; median, 48%) are level of evidence C, thus based  on expert opinion, case studies, or standards of care. Strikingly only 245 of 1305 class I recommendations are based on the highest level A evidence (median, 19%).

Another paper, published in Ann Intern Med 2011 [3], reaches similar conclusions analyzing the Infectious Diseases Society of America (IDSA) Practice Guidelines. Of the 4218 individual recommendations found, only 14% were supported by the strongest (level I) quality of evidence; more than half were based on level III evidence only. Like the ACC/AHH guidelines only a small part (23%) of the strongest IDSA recommendations, were based on level I evidence (in this case ≥1 randomized controlled trial, see below). And, here too, the new recommendations were mostly based on level II and III evidence.

Although there is little to argue about Hutchison’s observations, I do not agree with his conclusions.

In his view guidelines are equivalent to a bullet pointed list or flow diagram, allowing busy practitioners to move on from practice based on mere anecdote and opinion. It therefore seems contradictory that half of the EBM-guidelines are based on little more than anecdote (case series, extrapolation from other populations) and opinion. He then argues that guidelines, like other therapeutic interventions, should be considered in terms of balance between benefit and risk and that the risk  associated with the dissemination of poorly founded guidelines must also be considered. One of those risks is that doctors will just tend to adhere to the guidelines, and may even change their own (adequate) practice  in the absence of any scientific evidence against it. If a patient is harmed despite punctilious adherence to the guideline-rules,  “it is easy to be seduced into assuming that the bad outcome was therefore unavoidable”. But perhaps harm was done by following the guideline….

First of all, overall evidence shows that adherence to guidelines can improve patient outcome and provide more cost effective care (Naveed Mustfa in a comment refers to [4]).

Hutchinson’s piece is opinion-based and rather driven by (understandable) gut feelings and implicit assumptions, that also surround EBM in general.

  1. First there is the assumption that guidelines are a fixed set of rules, like a protocol, and that there is no room for preferences (both of the doctor and the patient), interpretations and experience. In the same way as EBM is often degraded to “cookbook medicine”, EBM guidelines are turned into mere bullet pointed lists made by a bunch of experts that just want to impose their opinions as truth.
  2. The second assumption (shared by many) is that evidence based medicine is synonymous with “randomized controlled trials”. In analogy, only those EBM guideline recommendations “count” that are based on RCT’s or meta-analyses.

Before I continue, I would strongly advice all readers (and certainly all EBM and guideline-skeptics) to read this excellent and clearly written BJM-editorial by David Sackett et al. that deals with misconceptions, myths and prejudices surrounding EBM : Evidence based medicine: what it is and what it isn’t [5].

Sackett et al define EBM as “the conscientious, explicit and judicious use of current best evidence in making decisions about the care of individual patients” [5]. Sackett emphasizes that “Good doctors use both individual clinical expertise and the best available external evidence, and neither alone is enough. Without clinical expertise, practice risks becoming tyrannised by evidence, for even excellent external evidence may be inapplicable to or inappropriate for an individual patient. Without current best evidence, practice risks becoming rapidly out of date, to the detriment of patients.”

Guidelines are meant to give recommendations based on the best available evidence. Guidelines should not be a set of rules, set in stone. Ideally, guidelines have gathered evidence in a transparent way and make it easier for the clinicians to grasp the evidence for a certain procedure in a certain situation … and to see the gaps.

Contrary to what many people think, EBM is not restricted to randomized trials and meta-analyses. It involves tracking down the best external evidence there is. As I explained in #NotSoFunny #16 – Ridiculing RCTs & EBM, evidence is not an all-or-nothing thing: RCT’s (if well performed) are the most robust, but if not available we have to rely on “lower” evidence (from cohort to case-control to case series or expert opinion even).
On the other hand RCT’s are often not even suitable to answer questions in other domains than therapy (etiology/harm, prognosis, diagnosis): per definition the level of evidence for these kind of questions inevitably will be low*. Also, for some interventions RCT’s are not appropriate, feasible or too costly to perform (cesarean vs vaginal birth; experimental therapies, rare diseases, see also [3]).

It is also good to realize that guidance, based on numerous randomized controlled trials is probably not or limited applicable to groups of patients who are seldom included in a RCT: the cognitively impaired, the patient with multiple comorbidities [6], the old patient [6], children and (often) women.

Finally not all RCTs are created equal (various forms of bias; surrogate outcomes; small sample sizes, short follow-up), and thus should not all represent the same high level of evidence.*

Thus in my opinion, low levels of evidence are not per definition problematic. Even if they are the basis for strong recommendations. As long as it is clear how the recommendations were reached and as long as these are well underpinned (by whatever evidence or motivation). One could see the exposed gaps in evidence as a positive thing as it may highlight the need for clinical research in certain fields.

There is one BIG BUT: my assumption is that guidelines are “just” recommendations based on exhaustive and objective reviews of existing evidence. No more, no less. This means that the clinician must have the freedom to deviate from the recommendations, based on his own expertise and/or the situation and/or the patient’s preferences. The more, when the evidence on which these strong recommendations are based is ‘scant’. Sackett already warned for the possible hijacking of EBM by purchasers and managers (and may I add health insurances and governmental agencies) to cut the costs of health care and to impose “rules”.

I therefore think it is odd that the ACC/AHA guidelines prescribe that Class I recommendations SHOULD be performed/administered even if they are based on level C recommendations (see Figure).

I also find it odd that different guidelines have a different nomenclature. The ACC/AHA have Class I, IIa, IIb and III recommendations and level A, B, C evidence where level A evidence represents sufficient evidence from multiple randomized trials and meta-analyses, whereas the strength of recommendations in the IDSA guidelines includes levels A through C (OR D/E recommendations against use) and quality of evidence ranges from level I through III , where I indicates evidence from (just) 1 properly randomized controlled trial. As explained in [3] this system was introduced to evaluate the effectiveness of preventive health care interventions in Canada (for which RCTs are apt).

Finally, guidelines and guideline makers should probably be more open for input/feedback from people who apply these guidelines.

————————————————

*the new GRADE (Grading of Recommendations Assessment, Development, and Evaluation) scoring system taking into account good quality observational studies as well may offer a potential solution.

Another possibly relevant post at this blog: The Best Study Design for … Dummies

Taken from a summary of an ACC/AHA guideline at http://guideline.gov/
Click to enlarge.

References

  1. Hutchison, G. (2012). Guidelines can harm patients too BMJ, 344 (apr18 1) DOI: 10.1136/bmj.e2685
  2. Tricoci P, Allen JM, Kramer JM, Califf RM, & Smith SC Jr (2009). Scientific evidence underlying the ACC/AHA clinical practice guidelines. JAMA : the journal of the American Medical Association, 301 (8), 831-41 PMID: 19244190
  3. Lee, D., & Vielemeyer, O. (2011). Analysis of Overall Level of Evidence Behind Infectious Diseases Society of America Practice Guidelines Archives of Internal Medicine, 171 (1), 18-22 DOI: 10.1001/archinternmed.2010.482
  4. Menéndez R, Reyes S, Martínez R, de la Cuadra P, Manuel Vallés J, & Vallterra J (2007). Economic evaluation of adherence to treatment guidelines in nonintensive care pneumonia. The European respiratory journal : official journal of the European Society for Clinical Respiratory Physiology, 29 (4), 751-6 PMID: 17005580
  5. Sackett, D., Rosenberg, W., Gray, J., Haynes, R., & Richardson, W. (1996). Evidence based medicine: what it is and what it isn’t BMJ, 312 (7023), 71-72 DOI: 10.1136/bmj.312.7023.71
  6. Aylett, V. (2010). Do geriatricians need guidelines? BMJ, 341 (sep29 3) DOI: 10.1136/bmj.c5340


What Did Deep DNA Sequencing of Traditional Chinese Medicines (TCMs) Really Reveal?

30 04 2012

ResearchBlogging.orgA recent study published in PLOS genetics[1] on a genetic audit of Traditional Chinese Medicines (TCMs) was widely covered in the news. The headlines are a bit confusing as they said different things. Some headlines say “Dangers of Chinese Medicine Brought to Light by DNA Studies“, others that Bear and Antelope DNA are Found in Traditional Chinese Medicine, and still others more neutrally: Breaking down traditional Chinese medicine.

What have Bunce and his group really done and what is the newsworthiness of this article?

doi:info:doi/10.1371/journal.pgen.1002657.g001

Photos from 4 TCM samples used in this study doi/10.1371/journal.pgen.1002657.g001

The researchers from the the Murdoch University, Australia,  have applied Second Generation, high-throughput sequencing to identify the plant and animal composition of 28 TCM samples (see Fig.). These TCM samples had been seized by Australian Customs and Border Protection Service at airports and seaports across Australia, because they contravened Australia’s international wildlife trade laws (Part 13A EPBC Act 1999).

Using primers specific for the plastid trnL gene (plants) and the mitochondrial 16S ribosomal RNA (animals), DNA of sufficient quality was obtained from 15 of the 28 (54%) TCM samples. The resultant 49,000 amplicons (amplified sequences) were analyzed by high-throughput sequencing and compared to reference databases.

Due to better GenBank coverage, the analysis of vertebrate DNA was simpler and less ambiguous than the analysis of the plant origins.

Four TCM samples – Saiga Antelope Horn powder, Bear Bile powder, powder in box with bear outline and Chu Pak Hou Tsao San powder were found to contain DNA from known CITES- (Convention on International Trade in Endangered Species) listed species. This is no real surprise, as the packages were labeled as such.

On the other hand some TCM samples, like the “100% pure” Saiga Antilope powder, were “diluted” with  DNA from bovids (i.e. goats and sheep), deer and/or toads. In 78% of the samples, animal DNA was identified that had not been clearly labeled as such on the packaging.

In total 68 different plant families were detected in the medicines. Some of the TCMs contained plants of potentially toxic genera like Ephedra and Asarum. Ephedra contains the sympathomimetic ephedrine, which has led to many, sometimes fatal, intoxications, also in Western countries. It should be noted however, that pharmacological activity cannot be demonstrated by DNA-analysis. Similarly, certain species of Asarum (wild ginger) contain the nephrotoxic and carcinogenic aristolochic acid, but it would require further testing to establish the presence of aristolochia acid in the samples positive for Asarum. Plant DNA assigned to other potentially toxic, allergic (nuts, soy) and/or subject to CITES regulation were also recovered. Again, other gene regions would need to be targeted, to reveal the exact species involved.

Most newspapers emphasized that the study has brought to light “the dangers of TCM”

For this reason The Telegraph interviewed an expert in the field, Edzard Ernst, Professor of Complementary Medicine at the University of Exeter. Ernst:

“The risks of Chinese herbal medicine are numerous: firstly, the herbs themselves can be toxic; secondly, they might interact with prescription drugs; thirdly, they are often contaminated with heavy metals; fourthly, they are frequently adulterated with prescription drugs; fifthly, the practitioners are often not well trained, make unsubstantiated claims and give irresponsible, dangerous advice to their patients.”

Ernst is right about the risks. However, these adverse effects of TCM have long been known. Fifteen years ago I happened to have written a bibliography about “adverse effects of herbal medicines*” (in Dutch, a good book on this topic is [2]). I did exclude interactions with prescription drugs, contamination with heavy metals and adulteration with prescription drugs, because the events (publications in PubMed and EMBASE) were to numerous(!). Toxic Chinese herbs mostly caused acute toxicity by aconitine, anticholinergic (datura, atropa) and podophyllotoxin intoxications. In Belgium 80 young women got nephropathy (kidney problems) after attending a “slimming” clinic because of mixup of Stephania (chinese: fangji) with Aristolochia fanghi (which contains the toxic aristolochic acid). Some of the women later developed urinary tract cancer.

In other words, toxic side effects of herbs including chinese herbs are long known. And the same is true for the presence of (traces of) endangered species in TCM.

In a media release the complementary health council (CHC) of Australia emphasized that the 15 TCM products featured in this study were rogue products seized by Customs as they were found to contain prohibited and undeclared ingredients. The CHC emphasizes the proficiency of rigorous regulatory regime around complementary medicines, i.e. all ingredients used in listed products must be on the permitted list of ingredients. However, Australian regulations do not apply to products purchased online from overseas.

Thus if the findings are not new and (perhaps) not applicable to most legal TCM, then what is the value of this paper?

The new aspect is the high throughput DNA sequencing approach, which allows determination of a larger number of animal and plant taxa than would have been possible through morphological and/or biochemical means. Various TCM-samples are suitable: powders, tablets, capsules, flakes and herbal teas.

There are also some limitations:

  1. DNA of sufficient quality could only be obtained from appr. half of the samples.
  2. Plants sequences could often not be resolved beyond the family level. Therefore it could often not be established whether an endangered of toxic species was really present (or an innocent family member).
  3. Only DNA sequences can be determined, not pharmacological activity.
  4. The method is at best semi-quantitative.
  5. Only plant and animal ingredients are determined, not contaminating heavy metals or prescription drugs.

In the future, species assignment (2) can be improved with the development of better reference databases involving multiple genes and (3) can be solved by combining genetic (sequencing) and metabolomic (for compound detection) approaches. According to the authors this may be a cost-effective way to audit TCM products.

Non-technical approaches may be equally important: like convincing consumers not to use medicines containing animal traces (not to speak of  endangered species), not to order  TCM online and to avoid the use of complex, uncontrolled TCM-mixes.

Furthermore, there should be more info on what works and what doesn’t.

*including but not limited to TCM

References

  1. Coghlan ML, Haile J, Houston J, Murray DC, White NE, Moolhuijzen P, Bellgard MI, & Bunce M (2012). Deep Sequencing of Plant and Animal DNA Contained within Traditional Chinese Medicines Reveals Legality Issues and Health Safety Concerns. PLoS genetics, 8 (4) PMID: 22511890 (Free Full Text)
  2. Adverse Effects of Herbal Drugs 2 P. A. G. M. De Smet K. Keller R. Hansel R. F. Chandler, Paperback. Springer 1993-01-15. ISBN 0387558004 / 0-387-55800-4 EAN 9780387558004
  3. DNA may weed out toxic Chinese medicine (abc.net.au)
  4. Bedreigde beren in potje Lucas Brouwers, NRC Wetenschap 14 april 2012, bl 3 [Dutch]
  5. Dangers in herbal medicine (continued) – DNA sequencing to hunt illegal ingredients (somethingaboutscience.wordpress.com)
  6. Breaking down traditional Chinese medicine. (green.blogs.nytimes.com)
  7. Dangers of Chinese Medicine Brought to Light by DNA Studies (news.sciencemag.org)
  8. Chinese herbal medicines contained toxic mix (cbc.ca)
  9. Screen uncovers hidden ingredients of Chinese medicine (Nature News)
  10. Media release: CHC emphasises proficiency of rigorous regulatory regime around complementary medicines (http://www.chc.org.au/)


Evidence Based Point of Care Summaries [2] More Uptodate with Dynamed.

18 10 2011

ResearchBlogging.orgThis post is part of a short series about Evidence Based Point of Care Summaries or POCs. In this series I will review 3 recent papers that objectively compare a selection of POCs.

In the previous post I reviewed a paper from Rita Banzi and colleagues from the Italian Cochrane Centre [1]. They analyzed 18 POCs with respect to their “volume”, content development and editorial policy. There were large differences among POCs, especially with regard to evidence-based methodology scores, but no product appeared the best according to the criteria used.

In this post I will review another paper by Banzi et al, published in the BMJ a few weeks ago [2].

This article examined the speed with which EBP-point of care summaries were updated using a prospective cohort design.

First the authors selected all the systematic reviews signaled by the American College of Physicians (ACP) Journal Club and Evidence-Based Medicine Primary Care and Internal Medicine from April to December 2009. In the same period the authors selected all the Cochrane systematic reviews labelled as “conclusion changed” in the Cochrane Library. In total 128 systematic reviews were retrieved, 68 from the literature surveillance journals (53%) and 60 (47%) from the Cochrane Library. Two months after the collection started (June 2009) the authors did a monthly screen for a year to look for potential citation of the identified 128 systematic reviews in the POCs.

Only those 5 POCs were studied that were ranked in the top quarter for at least 2 (out of 3) desirable dimensions, namely: Clinical Evidence, Dynamed, EBM Guidelines, UpToDate and eMedicine. Surprisingly eMedicine was among the selected POCs, having a rating of “1” on a scale of 1 to 15 for EBM methodology. One would think that Evidence-based-ness is a fundamental prerequisite  for EBM-POCs…..?!

Results were represented as a (rather odd, but clear) “survival analysis” ( “death” = a citation in a summary).

Fig.1 : Updating curves for relevant evidence by POCs (from [2])

I will be brief about the results.

Dynamed clearly beated all the other products  in its updating speed.

Expressed in figures, the updating speed of Dynamed was 78% and 97% greater than those of EBM Guidelines and Clinical Evidence, respectively. Dynamed had a median citation rate of around two months and EBM Guidelines around 10 months, quite close to the limit of the follow-up, but the citation rate of the other three point of care summaries (UpToDate, eMedicine, Clinical Evidence) were so slow that they exceeded the follow-up period and the authors could not compute the median.

Dynamed outperformed the other POC’s in updating of systematic reviews independent of the route. EBM Guidelines and UpToDate had similar overall updating rates, but Cochrane systematic reviews were more likely to be cited by EBM Guidelines than by UpToDate (odds ratio 0.02, P<0.001). Perhaps not surprising, as EBM Guidelines has a formal agreement with the Cochrane Collaboration to use Cochrane contents and label its summaries as “Cochrane inside.” On the other hand, UpToDate was faster than EBM Guidelines in updating systematic reviews signaled by literature surveillance journals.

Dynamed‘s higher updating ability was not due to a difference in identifying important new evidence, but to the speed with which this new information was incorporated in their summaries. Possibly the central updating of Dynamed by the editorial team might account for the more prompt inclusion of evidence.

As the authors rightly point out, slowness in updating could mean that new relevant information is ignored and could thus affect the validity of point of care information services”.

A slower updating rate may be considered more important for POCs that “promise” to “continuously update their evidence summaries” (EBM-Guidelines) or to “perform a continuous comprehensive review and to revise chapters whenever important new information is published, not according to any specific time schedule” (UpToDate). (see table with description of updating mechanisms )

In contrast, Emedicine doesn’t provide any detailed information on updating policy, another reason that it doesn’t belong to this list of best POCs.
Clinical Evidence, however, clearly states, We aim to update Clinical Evidence reviews annually. In addition to this cycle, details of clinically important studies are added to the relevant reviews throughout the year using the BMJ Updates service.” But BMJ Updates is not considered in the current analysis. Furthermore, patience is rewarded with excellent and complete summaries of evidence (in my opinion).

Indeed a major limitation of the current (and the previous) study by Banzi et al [1,2] is that they have looked at quantitative aspects and items that are relatively “easy to score”, like “volume” and “editorial quality”, not at the real quality of the evidence (previous post).

Although the findings were new to me, others have recently published similar results (studies were performed in the same time-span):

Shurtz and Foster [3] of the Texas A&M University Medical Sciences Library (MSL) also sought to establish a rubric for evaluating evidence-based medicine (EBM) point-of-care tools in a health sciences library.

They, too, looked at editorial quality and speed of updating plus reviewing content, search options, quality control, and grading.

Their main conclusion is that “differences between EBM tools’ options, content coverage, and usability were minimal, but that the products’ methods for locating and grading evidence varied widely in transparency and process”.

Thus this is in line with what Banzi et al reported in their first paper. They also share Banzi’s conclusion about differences in speed of updating

“DynaMed had the most up-to-date summaries (updated on average within 19 days), while First Consult had the least up to date (updated on average within 449 days). Six tools claimed to update summaries within 6 months or less. For the 10 topics searched, however, only DynaMed met this claim.”

Table 3 from Shurtz and Foster [3] 

Ketchum et al [4] also conclude that DynaMed the largest proportion of current (2007-2009) references (170/1131, 15%). In addition they found that Dynamed had the largest total number of references (1131/2330, 48.5%).

Yes, and you might have guessed it. The paper of Andrea Ketchum is the 3rd paper I’m going to review.

I also recommend to read the paper of the librarians Shurtz and Foster [3], which I found along the way. It has too much overlap with the Banzi papers to devote a separate post to it. Still it provides better background information then the Banzi papers, it focuses on POCs that claim to be EBM and doesn’t try to weigh one element over another. 

References

  1. Banzi, R., Liberati, A., Moschetti, I., Tagliabue, L., & Moja, L. (2010). A Review of Online Evidence-based Practice Point-of-Care Information Summary Providers Journal of Medical Internet Research, 12 (3) DOI: 10.2196/jmir.1288
  2. Banzi, R., Cinquini, M., Liberati, A., Moschetti, I., Pecoraro, V., Tagliabue, L., & Moja, L. (2011). Speed of updating online evidence based point of care summaries: prospective cohort analysis BMJ, 343 (sep22 2) DOI: 10.1136/bmj.d5856
  3. Shurtz, S., & Foster, M. (2011). Developing and using a rubric for evaluating evidence-based medicine point-of-care tools Journal of the Medical Library Association : JMLA, 99 (3), 247-254 DOI: 10.3163/1536-5050.99.3.012
  4. Ketchum, A., Saleh, A., & Jeong, K. (2011). Type of Evidence Behind Point-of-Care Clinical Information Products: A Bibliometric Analysis Journal of Medical Internet Research, 13 (1) DOI: 10.2196/jmir.1539
  5. Evidence Based Point of Care Summaries [1] No “Best” Among the Bests? (laikaspoetnik.wordpress.com)
  6. How will we ever keep up with 75 Trials and 11 Systematic Reviews a Day? (laikaspoetnik.wordpress.com
  7. UpToDate or Dynamed? (Shamsha Damani at laikaspoetnik.wordpress.com)
  8. How Evidence Based is UpToDate really? (laikaspoetnik.wordpress.com)

Related articles (automatically generated)


Evidence Based Point of Care Summaries [1] No “Best” Among the Bests?

13 10 2011

ResearchBlogging.orgFor many of today’s busy practicing clinicians, keeping up with the enormous and ever growing amount of medical information, poses substantial challenges [6]. Its impractical to do a PubMed search to answer each clinical question and then synthesize and appraise the evidence. Simply, because busy health care providers have limited time and many questions per day.

As repeatedly mentioned on this blog ([67]), it is far more efficient to try to find aggregate (or pre-filtered or pre-appraised) evidence first.

Haynes ‘‘5S’’ levels of evidence (adapted by [1])

There are several forms of aggregate evidence, often represented as the higher layers of an evidence pyramid (because they aggregate individual studies, represented by the lowest layer). There are confusingly many pyramids, however [8] with different kinds of hierarchies and based on different principles.

According to the “5S” paradigm[9] (now evolved to 6S -[10]) the peak of the pyramid are the ideal but not yet realized computer decision support systems, that link the individual patient characteristics to the current best evidence. According to the 5S model the next best source are Evidence Based Textbooks.
(Note: EBM and textbooks almost seem a contradiction in terms to me, personally I would not put many of the POCs somewhere at the top. Also see my post: How Evidence Based is UpToDate really?)

Whatever their exact place in the EBM-pyramid, these POCs are helpful to many clinicians. There are many different POCs (see The HLWIKI Canada for a comprehensive overview [11]) with a wide range of costs, varying from free with ads (e-Medicine) to very expensive site licenses (UpToDate). Because of the costs, hospital libraries have to choose among them.

Choices are often based on user preferences and satisfaction and balanced against costs, scope of coverage etc. Choices are often subjective and people tend to stick to the databases they know.

Initial literature about POCs concentrated on user preferences and satisfaction. A New Zealand study [3] among 84 GPs showed no significant difference in preference for, or usage levels of DynaMed, MD Consult (including FirstConsult) and UpToDate. The proportion of questions adequately answered by POCs differed per study (see introduction of [4] for an overview) varying from 20% to 70%.
McKibbon and Fridsma ([5] cited in [4]) found that the information resources chosen by primary care physicians were seldom helpful in providing the correct answers, leading them to conclude that:

“…the evidence base of the resources must be strong and current…We need to evaluate them well to determine how best to harness the resources to support good clinical decision making.”

Recent studies have tried to objectively compare online point-of-care summaries with respect to their breadth, content development, editorial policy, the speed of updating and the type of evidence cited. I will discuss 3 of these recent papers, but will review each paper separately. (My posts tend to be pretty long and in-depth. So in an effort to keep them readable I try to cut down where possible.)

Two of the three papers are published by Rita Banzi and colleagues from the Italian Cochrane Centre.

In the first paper, reviewed here, Banzi et al [1] first identified English Web-based POCs using Medline, Google, librarian association websites, and information conference proceedings from January to December 2008. In order to be eligible, a product had to be an online-delivered summary that is regularly updated, claims to provide evidence-based information and is to be used at the bedside.

They found 30 eligible POCs, of which the following 18 databases met the criteria: 5-Minute Clinical Consult, ACP-Pier, BestBETs, CKS (NHS), Clinical Evidence, DynaMed, eMedicine,  eTG complete, EBM Guidelines, First Consult, GP Notebook, Harrison’s Practice, Health Gate, Map Of Medicine, Micromedex, Pepid, UpToDate, ZynxEvidence.

They assessed and ranked these 18 point-of-care products according to: (1) coverage (volume) of medical conditions, (2) editorial quality, and (3) evidence-based methodology. (For operational definitions see appendix 1)

From a quantitive perspective DynaMed, eMedicine, and First Consult were the most comprehensive (88%) and eTG complete the least (45%).

The best editorial quality of EBP was delivered by Clinical Evidence (15), UpToDate (15), eMedicine (13), Dynamed (11) and eTG complete (10). (Scores are shown in brackets)

Finally, BestBETs, Clinical Evidence, EBM Guidelines and UpToDate obtained the maximal score (15 points each) for best evidence-based methodology, followed by DynaMed and Map Of Medicine (12 points each).
As expected eMedicine, eTG complete, First Consult, GP Notebook and Harrison’s Practice had a very low EBM score (1 point each). Personally I would not have even considered these online sources as “evidence based”.

The calculations seem very “exact”, but assumptions upon which these figures are based are open to question in my view. Furthermore all items have the same weight. Isn’t the evidence-based methodology far more important than “comprehensiveness” and editorial quality?

Certainly because “volume” is “just” estimated by analyzing to which extent 4 random chapters of the ICD-10 classification are covered by the POCs. Some sources, like Clinical Evidence and BestBets (scoring low for this item) don’t aim to be comprehensive but only “answer” a limited number of questions: they are not textbooks.

Editorial quality is determined by scoring of the specific indicators of transparency: authorship, peer reviewing procedure, updating, disclosure of authors’ conflicts of interest, and commercial support of content development.

For the EB methodology, Banzi et al scored the following indicators:

  1. Is a systematic literature search or surveillance the basis of content development?
  2. Is the critical appraisal method fully described?
  3. Are systematic reviews preferred over other types of publication?
  4. Is there a system for grading the quality of evidence?
  5. When expert opinion is included is it easily recognizable over studies’ data and results ?

The  score for each of these indicators is 3 for “yes”, 1 for “unclear”, and 0 for “no” ( if judged “not adequate” or “not reported.”)

This leaves little room for qualitative differences and mainly relies upon adequate reporting. As discussed earlier in a post where I questioned the evidence-based-ness of UpToDate, there is a difference between tailored searches and checking a limited list of sources (indicator 1.). It also matters whether the search is mentioned or not (transparency), whether it is qualitatively ok and whether it is extensive or not. For lists, it matters how many sources are “surveyed”. It also matters whether one or both methods are used… These important differences are not reflected by the scores.

Furthermore some points may be more important than others. Personally I find step 1 the most important. For what good is appraising and grading if it isn’t applied to the most relevant evidence? It is “easy” to do a grading or to copy it from other sources (yes, I wouldn’t be surprised if some POCs are doing this).

On the other hand, a zero for one indicator can have too much weight on the score.

Dynamed got 12 instead of the maximum 15 points, because their editorial policy page didn’t explicitly describe their absolute prioritization of systematic reviews although they really adhere to that in practice (see comment by editor-in-chief  Brian Alper [2]). Had Dynamed received the deserved 15 points for this indicator, they would have had the highest score overall.

The authors further conclude that none of the dimensions turned out to be significantly associated with the other dimensions. For example, BestBETs scored among the worst on volume (comprehensiveness), with an intermediate score for editorial quality, and the highest score for evidence-based methodology.  Overall, DynaMed, EBM Guidelines, and UpToDate scored in the top quartile for 2 out of 3 variables and in the 2nd quartile for the 3rd of these variables. (but as explained above Dynamed really scored in the top quartile for all 3 variables)

On basis of their findings Banzi et al conclude that only a few POCs satisfied the criteria, with none excelling in all.

The finding that Pepid, eMedicine, eTG complete, First Consult, GP Notebook, Harrison’s Practice and 5-Minute Clinical Consult only obtained 1 or 2 of the maximum 15 points for EBM methodology confirms my “intuitive grasp” that these sources really don’t deserve the label “evidence based”. Perhaps we should make a more strict distinction between “point of care” databases as a point where patients and practitioners interact, particularly referring to the context of the provider-patient dyad (definition by Banzi et al) and truly evidence based summaries. Only few of the tested databases would fit the latter definition. 

In summary, Banzi et al reviewed 18 Online Evidence-based Practice Point-of-Care Information Summary Providers. They comprehensively evaluated and summarized these resources with respect to coverage (volume) of medical conditions, editorial quality, and (3) evidence-based methodology. 

Limitations of the study, also according to the authors, were the lack of a clear definition of these products, arbitrariness of the scoring system and emphasis on the quality of reporting. Furthermore the study didn’t really assess the products qualitatively (i.e. with respect to performance). Nor did it take into account that products might have a different aim. Clinical Evidence only summarizes evidence on the effectiveness of treatments of a limited number of diseases, for instance. Therefore it scores bad on volume while excelling on the other items. 

Nevertheless it is helpful that POCs are objectively compared and it may help as starting point for decisions about acquisition.

References (not in chronological order)

  1. Banzi, R., Liberati, A., Moschetti, I., Tagliabue, L., & Moja, L. (2010). A Review of Online Evidence-based Practice Point-of-Care Information Summary Providers Journal of Medical Internet Research, 12 (3) DOI: 10.2196/jmir.1288
  2. Alper, B. (2010). Review of Online Evidence-based Practice Point-of-Care Information Summary Providers: Response by the Publisher of DynaMed Journal of Medical Internet Research, 12 (3) DOI: 10.2196/jmir.1622
  3. Goodyear-Smith F, Kerse N, Warren J, & Arroll B (2008). Evaluation of e-textbooks. DynaMed, MD Consult and UpToDate. Australian family physician, 37 (10), 878-82 PMID: 19002313
  4. Ketchum, A., Saleh, A., & Jeong, K. (2011). Type of Evidence Behind Point-of-Care Clinical Information Products: A Bibliometric Analysis Journal of Medical Internet Research, 13 (1) DOI: 10.2196/jmir.1539
  5. McKibbon, K., & Fridsma, D. (2006). Effectiveness of Clinician-selected Electronic Information Resources for Answering Primary Care Physicians’ Information Needs Journal of the American Medical Informatics Association, 13 (6), 653-659 DOI: 10.1197/jamia.M2087
  6. How will we ever keep up with 75 Trials and 11 Systematic Reviews a Day? (laikaspoetnik.wordpress.com)
  7. 10 + 1 PubMed Tips for Residents (and their Instructors) (laikaspoetnik.wordpress.com)
  8. Time to weed the (EBM-)pyramids?! (laikaspoetnik.wordpress.com)
  9. Haynes RB. Of studies, syntheses, synopses, summaries, and systems: the “5S” evolution of information services for evidence-based healthcare decisions. Evid Based Med 2006 Dec;11(6):162-164. [PubMed]
  10. DiCenso A, Bayley L, Haynes RB. ACP Journal Club. Editorial: Accessing preappraised evidence: fine-tuning the 5S model into a 6S model. Ann Intern Med. 2009 Sep 15;151(6):JC3-2, JC3-3. PubMed PMID: 19755349 [free full text].
  11. How Evidence Based is UpToDate really? (laikaspoetnik.wordpress.com)
  12. Point_of_care_decision-making_tools_-_Overview (hlwiki.slais.ubc.ca)
  13. UpToDate or Dynamed? (Shamsha Damani at laikaspoetnik.wordpress.com)

Related articles (automatically generated)


FUTON Bias. Or Why Limiting to Free Full Text Might not Always be a Good Idea.

8 09 2011

ResearchBlogging.orgA few weeks ago I was discussing possible relevant papers for the Twitter Journal Club  (Hashtag #TwitJC), a succesful initiative on Twitter, that I have discussed previously here and here [7,8].

I proposed an article, that appeared behind a paywall. Annemarie Cunningham (@amcunningham) immediately ran the idea down, stressing that open-access (OA) is a pre-requisite for the TwitJC journal club.

One of the TwitJC organizers, Fi Douglas (@fidouglas on Twitter), argued that using paid-for journals would defeat the objective that  #TwitJC is open to everyone. I can imagine that fee-based articles could set a too high threshold for many doctors. In addition, I sympathize with promoting OA.

However, I disagree with Annemarie that an OA (or rather free) paper is a prerequisite if you really want to talk about what might impact on practice. On the contrary, limiting to free full text (FFT) papers in PubMed might lead to bias: picking “low hanging fruit of convenience” might mean that the paper isn’t representative and/or doesn’t reflect the current best evidence.

But is there evidence for my theory that selecting FFT papers might lead to bias?

Lets first look at the extent of the problem. Which percentage of papers do we miss by limiting for free-access papers?

survey in PLOS by Björk et al [1] found that one in five peer reviewed research papers published in 2008 were freely available on the internet. Overall 8,5% of the articles published in 2008 (and 13,9 % in Medicine) were freely available at the publishers’ sites (gold OA).  For an additional 11,9% free manuscript versions could be found via the green route:  i.e. copies in repositories and web sites (7,8% in Medicine).
As a commenter rightly stated, the lag time is also important, as we would like to have immediate access to recently published research, yet some publishers (37%) impose an access-embargo of 6-12 months or more. (these papers were largely missed as the 2008 OA status was assessed late 2009).

PLOS 2009

The strength of the paper is that it measures  OA prevalence on an article basis, not on calculating the share of journals which are OA: an OA journal generally contains a lower number of articles.
The authors randomly sampled from 1.2 million articles using the advanced search facility of Scopus. They measured what share of OA copies the average researcher would find using Google.

Another paper published in  J Med Libr Assoc (2009) [2], using similar methods as the PLOS survey examined the state of open access (OA) specifically in the biomedical field. Because of its broad coverage and popularity in the biomedical field, PubMed was chosen to collect their target sample of 4,667 articles. Matsubayashi et al used four different databases and search engines to identify full text copies. The authors reported an OA percentage of 26,3 for peer reviewed articles (70% of all articles), which is comparable to the results of Björk et al. More than 70% of the OA articles were provided through journal websites. The percentages of green OA articles from the websites of authors or in institutional repositories was quite low (5.9% and 4.8%, respectively).

In their discussion of the findings of Matsubayashi et al, Björk et al. [1] quickly assessed the OA status in PubMed by using the new “link to Free Full Text” search facility. First they searched for all “journal articles” published in 2005 and then repeated this with the further restrictions of “link to FFT”. The PubMed OA percentages obtained this way were 23,1 for 2005 and 23,3 for 2008.

This proportion of biomedical OA papers is gradually increasing. A chart in Nature’s News Blog [9] shows that the proportion of papers indexed on the PubMed repository each year has increased from 23% in 2005 to above 28% in 2009.
(Methods are not shown, though. The 2008 data are higher than those of Björk et al, who noticed little difference with 2005. The Data for this chart, however, are from David Lipman, NCBI director and driving force behind the digital OA archive PubMed Central).
Again, because of the embargo periods, not all literature is immediately available at the time that it is published.

In summary, we would miss about 70% of biomedical papers by limiting for FFT papers. However, we would miss an even larger proportion of papers if we limit ourselves to recently published ones.

Of course, the key question is whether ignoring relevant studies not available in full text really matters.

Reinhard Wentz of the Imperial College Library and Information Service already argued in a visionary 2002 Lancet letter[3] that the availability of full-text articles on the internet might have created a new form of bias: FUTON bias (Full Text On the Net bias).

Wentz reasoned that FUTON bias will not affect researchers who are used to comprehensive searches of published medical studies, but that it will affect staff and students with limited experience in doing searches and that it might have the same effect in daily clinical practice as publication bias or language bias when doing systematic reviews of published studies.

Wentz also hypothesized that FUTON bias (together with no abstract available (NAA) bias) will affect the visibility and the impact factor of OA journals. He makes a reasonable cause that the NAA-bias will affect publications on new, peripheral, and under-discussion subjects more than established topics covered in substantive reports.

The study of Murali et al [4] published in Mayo Proceedings 2004 confirms that the availability of journals on MEDLINE as FUTON or NAA affects their impact factor.

Of the 324 journals screened by Murali et al. 38.3% were FUTON, 19.1%  NAA and 42.6% had abstracts only. The mean impact factor was 3.24 (±0.32), 1.64 (±0.30), and 0.14 (±0.45), respectively! The authors confirmed this finding by showing a difference in impact factors for journals available in both the pre and the post-Internet era (n=159).

Murali et al informally questioned many physicians and residents at multiple national and international meetings in 2003. These doctors uniformly admitted relying on FUTON articles on the Web to answer a sizable proportion of their questions. A study by Carney et al (2004) [5] showed  that 98% of the US primary care physicians used the Internet as a resource for clinical information at least once a week and mostly used FUTON articles to aid decisions about patient care or patient education and medical student or resident instruction.

Murali et al therefore conclude that failure to consider FUTON bias may not only affect a journal’s impact factor, but could also limit consideration of medical literature by ignoring relevant for-fee articles and thereby influence medical education akin to publication or language bias.

This proposed effect of the FFT limit on citation retrieval for clinical questions, was examined in a  more recent study (2008), published in J Med Libr Assoc [6].

Across all 4 questions based on a research agenda for physical therapy, the FFT limit reduced the number of citations to 11.1% of the total number of citations retrieved without the FFT limit in PubMed.

Even more important, high-quality evidence such as systematic reviews and randomized controlled trials were missed when the FFT limit was used.

For example, when searching without the FFT limit, 10 systematic reviews of RCTs were retrieved against one when the FFT limit was used. Likewise when searching without the FFT limit, 28 RCTs were retrieved and only one was retrieved when the FFT limit was used.

The proportion of missed studies (appr. 90%) is higher than in the studies mentioned above. Possibly this is because real searches have been tested and that only relevant clinical studies  have been considered.

The authors rightly conclude that consistently missing high-quality evidence when searching clinical questions is problematic because it undermines the process of Evicence Based Practice. Krieger et al finally conclude:

“Librarians can educate health care consumers, scientists, and clinicians about the effects that the FFT limit may have on their information retrieval and the ways it ultimately may affect their health care and clinical decision making.”

It is the hope of this librarian that she did a little education in this respect and clarified the point that limiting to free full text might not always be a good idea. Especially if the aim is to critically appraise a topic, to educate or to discuss current best medical practice.

References

  1. Björk, B., Welling, P., Laakso, M., Majlender, P., Hedlund, T., & Guðnason, G. (2010). Open Access to the Scientific Journal Literature: Situation 2009 PLoS ONE, 5 (6) DOI: 10.1371/journal.pone.0011273
  2. Matsubayashi, M., Kurata, K., Sakai, Y., Morioka, T., Kato, S., Mine, S., & Ueda, S. (2009). Status of open access in the biomedical field in 2005 Journal of the Medical Library Association : JMLA, 97 (1), 4-11 DOI: 10.3163/1536-5050.97.1.002
  3. WENTZ, R. (2002). Visibility of research: FUTON bias The Lancet, 360 (9341), 1256-1256 DOI: 10.1016/S0140-6736(02)11264-5
  4. Murali NS, Murali HR, Auethavekiat P, Erwin PJ, Mandrekar JN, Manek NJ, & Ghosh AK (2004). Impact of FUTON and NAA bias on visibility of research. Mayo Clinic proceedings. Mayo Clinic, 79 (8), 1001-6 PMID: 15301326
  5. Carney PA, Poor DA, Schifferdecker KE, Gephart DS, Brooks WB, & Nierenberg DW (2004). Computer use among community-based primary care physician preceptors. Academic medicine : journal of the Association of American Medical Colleges, 79 (6), 580-90 PMID: 15165980
  6. Krieger, M., Richter, R., & Austin, T. (2008). An exploratory analysis of PubMed’s free full-text limit on citation retrieval for clinical questions Journal of the Medical Library Association : JMLA, 96 (4), 351-355 DOI: 10.3163/1536-5050.96.4.010
  7. The #TwitJC Twitter Journal Club, a new Initiative on Twitter. Some Initial Thoughts. (laikaspoetnik.wordpress.com)
  8. The Second #TwitJC Twitter Journal Club (laikaspoetnik.wordpress.com)
  9. How many research papers are freely available? (blogs.nature.com)


PubMed’s Higher Sensitivity than OVID MEDLINE… & other Published Clichés.

21 08 2011

ResearchBlogging.orgIs it just me, or are biomedical papers about searching for a systematic review often of low quality or just too damn obvious? I’m seldom excited about papers dealing with optimal search strategies or peculiarities of PubMed, even though it is my specialty.
It is my impression, that many of the lower quality and/or less relevant papers are written by clinicians/researchers instead of information specialists (or at least no medical librarian as the first author).

I can’t help thinking that many of those authors just happen to see an odd feature in PubMed or encounter an unexpected  phenomenon in the process of searching for a systematic review.
They think: “Hey, that’s interesting” or “that’s odd. Lets write a paper about it.” An easy way to boost our scientific output!
What they don’t realize is that the published findings are often common knowledge to the experienced MEDLINE searchers.

Lets give two recent examples of what I think are redundant papers.

The first example is a letter under the heading “Clinical Observation” in Annals of Internal Medicine, entitled:

“Limitations of the MEDLINE Database in Constructing Meta-analyses”.[1]

As the authors rightly state “a thorough literature search is of utmost importance in constructing a meta-analysis. Since the PubMed interface from the National Library of Medicine is a cornerstone of many meta-analysis,  the authors (two MD’s) focused on the freely available PubMed” (with MEDLINE as its largest part).

The objective was:

“To assess the accuracy of MEDLINE’s “human” and “clinical trial” search limits, which are used by authors to focus literature searches on relevant articles.” (emphasis mine)

O.k…. Stop! I know enough. This paper should have be titled: “Limitation of Limits in MEDLINE”.

Limits are NOT DONE, when searching for a systematic review. For the simple reason that most limits (except language and dates) are MESH-terms.
It takes a while before the indexers have assigned a MESH to the papers and not all papers are correctly (or consistently) indexed. Thus, by using limits you will automatically miss recent, not yet, or not correctly indexed papers. Whereas it is your goal (or it should be) to find as many relevant papers as possible for your systematic review. And wouldn’t it be sad if you missed that one important RCT that was published just the other day?

On the other hand, one doesn’t want to drown in irrelevant papers. How can one reduce “noise” while minimizing the risk of loosing relevant papers?

  1. Use both MESH and textwords to “limit” you search, i.e. also search “trial” as textword, i.e. in title and abstract: trial[tiab]
  2. Use more synonyms and truncation (random*[tiab] OR  placebo[tiab])
  3. Don’t actively limit but use double negation. Thus to get rid of animal studies, don’t limit to humans (this is the same as combining with MeSH [mh]) but safely exclude animals as follows: NOT animals[mh] NOT humans[mh] (= exclude papers indexed with “animals” except when these papers are also indexed with “humans”).
  4. Use existing Methodological Filters (ready-made search strategies) designed to help focusing on study types. These filters are based on one or more of the above-mentioned principles (see earlier posts here and here).
    Simple Methodological Filters can be found at the PubMed Clinical Queries. For instance the narrow filter for Therapy not only searches for the Publication Type “Randomized controlled trial” (a limit), but also for randomized, controlled ànd  trial  as textwords.
    Usually broader (more sensitive) filters are used for systematic reviews. The Cochrane handbook proposes to use the following filter maximizing precision and sensitivity to identify randomized trials in PubMed (see http://www.cochrane-handbook.org/):
    (randomized controlled trial [pt] OR controlled clinical trial [pt] OR randomized [tiab] OR placebo [tiab] OR clinical trials as topic [mesh: noexp] OR randomly [tiab] OR trial [ti]) NOT (animals [mh] NOT humans [mh]).
    When few hits are obtained, one can either use a broader filter or no filter at all.

In other words, it is a beginner’s mistake to use limits when searching for a systematic review.
Besides that the authors publish what should be common knowledge (even our medical students learn it) they make many other (little) mistakes, their precise search is difficult to reproduce and far from complete. This is already addressed by Dutch colleagues in a comment [2].

The second paper is:

PubMed had a higher sensitivity than Ovid-MEDLINE in the search for systematic reviews [3], by Katchamart et al.

Again this paper focuses on the usefulness of PubMed to identify RCT’s for a systematic review, but it concentrates on the differences between PubMed and OVID in this respect. The paper starts with  explaining that PubMed:

provides access to bibliographic information in addition to MEDLINE, such as in-process citations (..), some OLDMEDLINE citations (….) citations that precede the date that a journal was selected for MEDLINE indexing, and some additional life science journals that submit full texts to PubMed Central and receive a qualitative review by NLM.

Given these “facts”, am I exaggerating when I am saying that the authors are pushing at an open door when their main conclusion is that PubMed retrieved more citations overall than Ovid-MEDLINE? The one (!) relevant article missed in OVID was a 2005 study published in a Japanese journal that MEDLINE started indexing in 2007. It was therefore in PubMed, but not in OVID MEDLINE.

An important aspect to keep in mind when searching OVID/MEDLINE ( I have earlier discussed here and here). But worth a paper?

Recently, after finishing an exhaustive search in OVID/MEDLINE, we noticed that we missed a RCT in PubMed, that was not yet available in OVID/MEDLINE.  I just added one sentence to the search methods:

Additionally, PubMed was searched for randomized controlled trials ahead of print, not yet included in OVID MEDLINE. 

Of course, I could have devoted a separate article to this finding. But it is so self-evident, that I don’t think it would be worth it.

The authors have expressed their findings in sensitivity (85% for Ovid-MEDLINE vs. 90% for PubMed, 5% is that ONE paper missing), precision and  number to read (comparable for OVID-MEDLINE and PubMed).

If I might venture another opinion: it looks like editors of medical and epidemiology journals quickly fall for “diagnostic parameters” on a topic that they don’t understand very well: library science.

The sensitivity/precision data found have little general value, because:

  • it concerns a single search on a single topic
  • there are few relevant papers (17- 18)
  • useful features of OVID MEDLINE that are not available in PubMed are not used. I.e. Adjacency searching could enhance the retrieval of relevant papers in OVID MEDLINE (adjacency=words searched within a specified maximal distance of each other)
  • the searches are not comparable, nor are the search field commands.

The latter is very important, if one doesn’t wish to compare apples and oranges.

Lets take a look at the first part of the search (which is in itself well structured and covers many synonyms).
First part of the search - Click to enlarge
This part of the search deals with the P: patients with rheumatoid arthritis (RA). The authors first search for relevant MeSH (set 1-5) and then for a few textwords. The MeSH are fine. The authors have chosen to use Arthritis, rheumatoid and a few narrower terms (MeSH-tree shown at the right). The authors have taken care to use the MeSH:noexp command in PubMed to prevent the automatic explosion of narrower terms in PubMed (although this is superfluous for MesH terms having no narrow terms, like Caplan syndrome etc.).

But the fields chosen for the free text search (sets 6-9) are not comparable at all.

In OVID the mp. field is used, whereas all fields or even no fields are used in PubMed.

I am not even fond of the uncontrolled use of .mp (I rather search in title and abstract, remember we already have the proper MESH-terms), but all fields is even broader than .mp.

In general a .mp. search looks in the Title, Original Title, Abstract, Subject Heading, Name of Substance, and Registry Word fields. All fields would be .af in OVID not .mp.

Searching for rheumatism in OVID using the .mp field yields 7879 hits against 31390 hits when one searches in the .af field.

Thus 4 times as much. Extra fields searched are for instance the journal and the address field. One finds all articles in the journal Arthritis & Rheumatism for instance [line 6], or papers co-authored by someone of the dept. of rheumatoid surgery [line 9]

Worse, in PubMed the “all fields” command doesn’t prevent the automatic mapping.

In PubMed, Rheumatism[All Fields] is translated as follows:

“rheumatic diseases”[MeSH Terms] OR (“rheumatic”[All Fields] AND “diseases”[All Fields]) OR “rheumatic diseases”[All Fields] OR “rheumatism”[All Fields]

Oops, Rheumatism[All Fields] is searched as the (exploded!) MeSH rheumatic diseases. Thus rheumatic diseases (not included in the MeSH-search) plus all its narrower terms! This makes the entire first part of the PubMed search obsolete (where the authors searched for non-exploded specific terms). It explains the large difference in hits with rheumatism between PubMed and OVID/MEDLINE: 11910 vs 6945.

Not only do the authors use this .mp and [all fields] command instead of the preferred [tiab] field, they also apply this broader field to the existing (optimized) Cochrane filter, that uses [tiab]. Finally they use limits!

Well anyway, I hope that I made my point that useful comparison between strategies can only be made if optimal strategies and comparable  strategies are used. Sensitivity doesn’t mean anything here.

Coming back to my original point. I do think that some conclusions of these papers are “good to know”. As a matter of fact it should be basic knowledge for those planning an exhaustive search for a systematic review. We do not need bad studies to show this.

Perhaps an expert paper (or a series) on this topic, understandable for clinicians, would be of more value.

Or the recognition that such search papers should be designed and written by librarians with ample experience in searching for systematic reviews.

NOTE:
* = truncation=search for different word endings; [tiab] = title and abstract; [ti]=title; mh=mesh; pt=publication type

Photo credit

The image is taken from the Dragonfly-blog; here the Flickr-image Brain Vocab Sketch by labguest was adapted by adding the Pubmed logo.

References

  1. Winchester DE, & Bavry AA (2010). Limitations of the MEDLINE database in constructing meta-analyses. Annals of internal medicine, 153 (5), 347-8 PMID: 20820050
  2. Leclercq E, Kramer B, & Schats W (2011). Limitations of the MEDLINE database in constructing meta-analyses. Annals of internal medicine, 154 (5) PMID: 21357916
  3. Katchamart W, Faulkner A, Feldman B, Tomlinson G, & Bombardier C (2011). PubMed had a higher sensitivity than Ovid-MEDLINE in the search for systematic reviews. Journal of clinical epidemiology, 64 (7), 805-7 PMID: 20926257
  4. Search OVID EMBASE and Get MEDLINE for Free…. without knowing it (laikaspoetnik.wordpress.com 2010/10/19/)
  5. 10 + 1 PubMed Tips for Residents (and their Instructors) (laikaspoetnik.wordpress.com 2009/06/30)
  6. Adding Methodological filters to myncbi (laikaspoetnik.wordpress.com 2009/11/26/)
  7. Search filters 1. An Introduction (laikaspoetnik.wordpress.com 2009/01/22/)


HOT TOPIC: Does Soy Relieve Hot Flashes?

20 06 2011

ResearchBlogging.orgThe theme of the Upcoming Grand Rounds held at June 21th (1st day of the Summer) at Shrink Rap is “hot”. A bit far-fetched, but aah you know….shrinks“. Of course they hope  assume  that we will express Weiner-like exhibitionism at our blogs. Or go into spicy details of hot sexpectations or other Penis Friday NCBI-ROFL posts. But no, not me, scientist and librarian to my bone marrow. I will stick to boring, solid science and will do a thorough search to find the evidence. Here I will discuss whether soy really helps to relieve hot flashes (also called hot flushes).

…..As illustrated by this HOT picture, I should post as well…..

(CC from Katy Tresedder, Flickr):

Yes, many menopausal women plagued by hot flashes take their relief  in soy or other phytoestrogens (estrogen-like chemicals derived from plants). I know, because I happen to have many menopausal women in my circle of friends who prefer taking soy over estrogen. They rather not take normal hormone replacement therapy, because this can have adverse effects if taken for a longer time. Soy on the other hand is considered a “natural remedy”, and harmless. Probably physiological doses of soy (food) are harmless and therefore a better choice than the similarly “natural” black cohosh, which is suspected to give liver injury and other adverse effects.

But is soy effective?

I did a quick search in PubMed and found a Cochrane Systematic Review from 2007 that was recently edited with no change to the conclusions.

This review looked at several phytoestrogens that were offered in several ways, as: dietary soy (9x) (powder, cereals, drinks, muffins), soy extracts (9x), red clover extracts (7x, including Promensil (5x)), Genistein extract , Flaxseed, hop-extract  and a Chinese medicinal herb.

Thirty randomized controlled trials with a total of 2730 participants met the inclusion criteria: the participants were women in or just before their menopause complaining of vasomotor symptoms (thus having hot flashes) for at least 12 weeks. The intervention was a food or supplement with high levels of phytoestrogens (not any other herbal treatment) and this was compared with placebo, no treatment or hormone replacement therapy.

Only 5 trials using the red clover extract Promensil were homogenous enough to combine in a meta-analysis. The effect on one outcome (incidence of hot flashes) is shown below. As can be seen at a glance, Promensil had no significant effect, whether given in a low (40 mg/day) or a higher (80 mg/day) dose. This was also true for the other outcomes.

The other phytoestrogen interventions were very heterogeneous with respect to dose, composition and type. This was especially true for the dietary soy treatment. Although some of the trials showed a positive effect of phytoestrogens on hot flashes and night sweats, overall, phytoestrogens were no better than the comparisons.

Most trials were small,  of short duration and/or of poor quality. Fewer than half of the studies (n=12) indicated that allocation had been concealed from the trial investigators.

One striking finding was that there was a strong placebo effect in most trials with a reduction in frequency of hot flashes ranging from 1% to 59% .

I also found another systematic review in PubMed by Bolaños R et al , that limited itself only to soy. Other differences with the Cochrane Systematic Review (besides the much simpler search 😉 ) were: inclusion of more recently published clinical trials, no inclusion of unpublished studies and less strict exclusion on basis of low methodological quality. Furthermore, genestein was (rightly) considered as a soy product.

The group of studies that used soy dietary supplement showed the highest heterogeneity. Overall, the results “showed a significant tendency(?)  in favor of soy. Nevertheless the authors conclude (similar to the Cochrane authors), that  it is still difficult to establish conclusive results given the high heterogeneity found in the studies. (but apparently the data could still be pooled?)

References

  • Lethaby A, Marjoribanks J, Kronenberg F, Roberts H, Eden J, & Brown J. (2007). Phytoestrogens for vasomotor menopausal symptoms Cochrane Database of Systematic Reviews (4) : 10.1002/14651858.CD001395.pub3.
  • Bolaños R, Del Castillo A, & Francia J (2010). Soy isoflavones versus placebo in the treatment of climacteric vasomotor symptoms: systematic review and meta-analysis. Menopause (New York, N.Y.), 17 (3), 660-6 PMID: 20464785